The Banking Crisis That Wasn’t
Investing in banks in 2023 was not for the faint of heart. The regional bank failures in the spring highlighted concerns relating to the rapid rise of interest rates and the resulting impact to bank investment portfolios and accumulated other comprehensive income (AOCI). While the bank failures were more idiosyncratic than systemic, given their unique business models, bank debt and equity markets remained dislocated. Over the past couple of quarters, contagion risk has faded as bank earnings proved resilient and stricter regulation is anticipated. Additionally, as rates rallied into year-end, AOCI and capital levels have likely improved, as have equity valuations to some degree. Bank debt tends to lag equity performance and is well positioned to outperform in 2024.
Figure 1: QABA YTD 2023 Return By Month
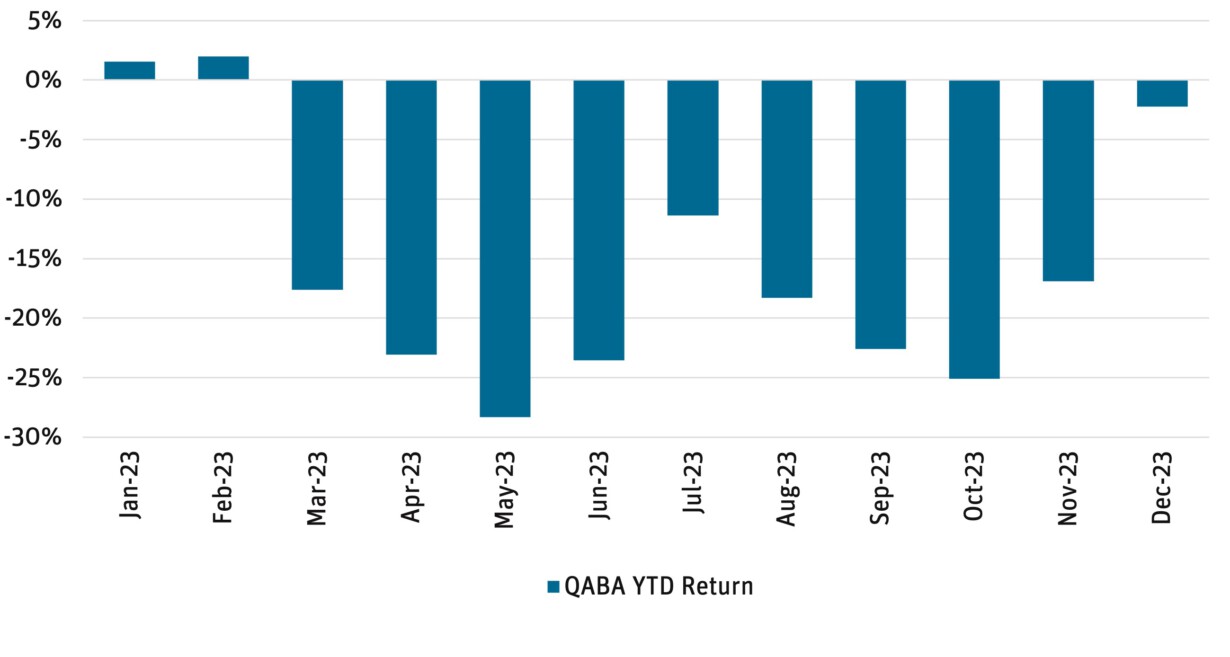
Source: Bloomberg as of 12/31/23.
Emerging Stronger
The bank failures and ensuing market volatility beginning in March 2023 were largely driven by liquidity concerns in conjunction with the rapid rise in interest rates. This was particularly evident in the unique business models of the failed regional banks, given their highly concentrated deposit bases and high level of uninsured deposits. Banks typically lag interest rate increases, and similarly were slow to adjust deposit rates to the steep increase in interest rates this cycle. When weakness surfaced in the banking sector, depositors withdrew their funds at an unprecedented pace and banks were forced to sell bonds out of their investment portfolios, realizing losses and, as a result, eroding their capital bases. As part of their response, regulators created a new Bank Term Funding Program (BTFP) at the Discount Window, allowing banks to borrow the par value of a wider range of securities so banks could avoid selling bonds and realizing losses for non-impaired securities. The BTFP was successful as part of the solution to quickly stabilize the banking system. Since then, banks have worked hard to strengthen their deposit bases. Banks adjusted deposit rates higher, to levels more commensurate with market rates (pressuring net interest margins) and also employed creative solutions to enhance the amount of deposit insurance available to their depositors. Additionally, over the course of 2023 the level of uninsured bank deposits improved meaningfully.
Figure 2: Angel Oak Community Bank Composite Index
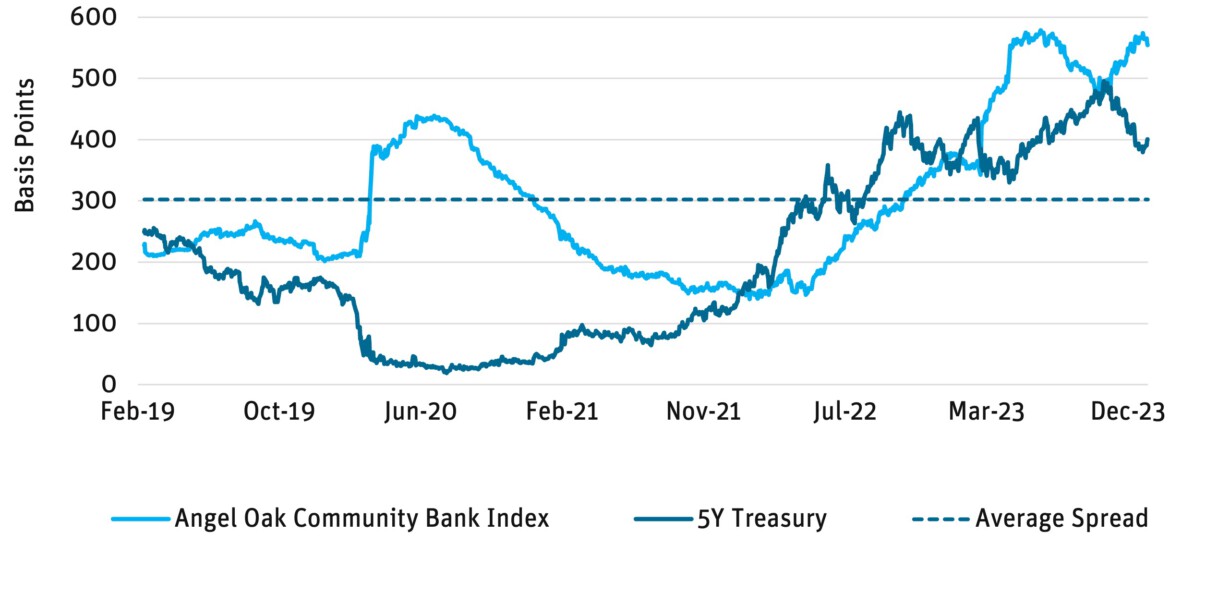
Source: Angel Oak Capital, Bloomberg as of 12/31/23.
BTFP Expiration
Deposit platforms are more stable entering 2024 than they were a year ago. Deposit costs are at or near peak, and margin pressure should alleviate from current levels as 1) deposit competition fades in the face of slower loan growth, 2) maturing CDs begin to reprice lower, and 3) the Fed begins to cut interest rates. The debate on the deposit side centers on whether the BTFP (expiring March 11, 2024) will be renewed. Most market participants expect the facility will not be renewed, given deposit stability, the decrease in rates, and the unintended arbitrage created. Utilization of the facility has been increasing of late, likely due to the arbitrage available between the cost to borrow under the BTFP and the rate of interest the Fed pays on excess reserves (Figure 3).
Figure 3: Gap Between IORB And BTFP Rates At Widest Levels
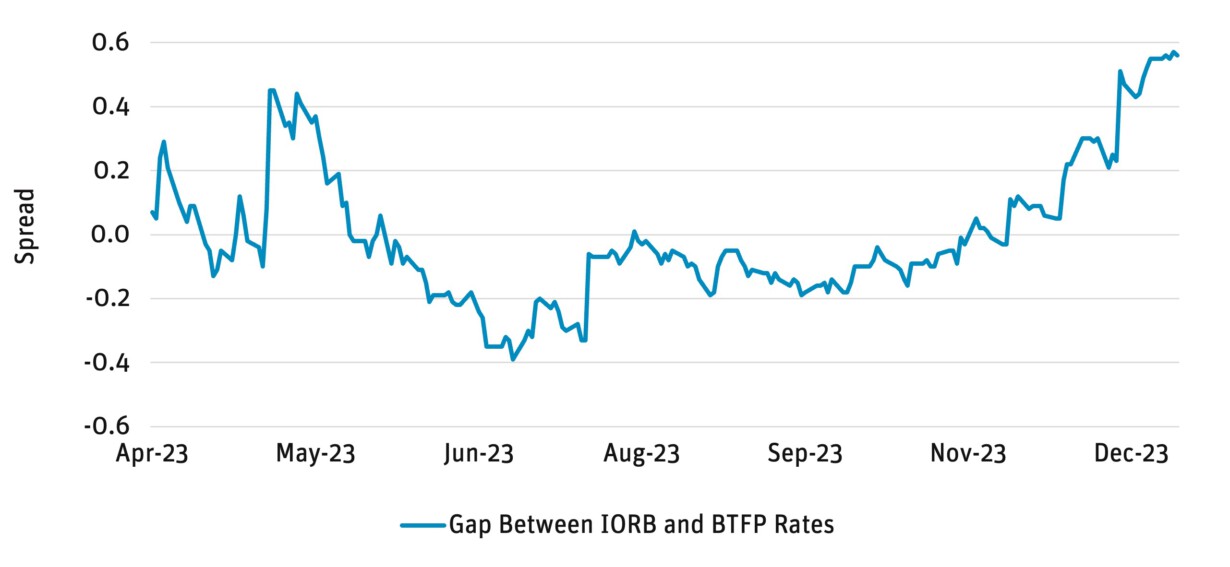
Source: Bloomberg as of 12/31/23.
Regulators likely view this unfavorably as banks are essentially earning a risk-free spread by borrowing from the BTFP and leaving the funds on deposit at the Fed. Even with the expected expiration of the BTFP, banks still have access to the Fed’s Discount Window and the Standing Repo Facility as contingent sources of liquidity.
The Road Ahead
While 2024 likely brings with it a still-tough operating environment for banks, net interest margin (NIM) pressures are abating, valuations are cheap, and merger and acquisition (M&A) activity should accelerate. Navigating the rate and credit environment and managing expenses will be top of mind for bank management teams.
NIM: NIM pressures should gradually fade with the Fed on pause. Margins will continue to compress on higher funding costs in the near term, but at a decelerating pace, before stabilizing and shifting to expansion in the second half of 2024. Historically, deposit costs continue to rise until the Fed begins cutting rates. Loan and securities repricing will provide an offset to higher funding costs.
Figure 4: NIM Pressure Should Gradually Fade
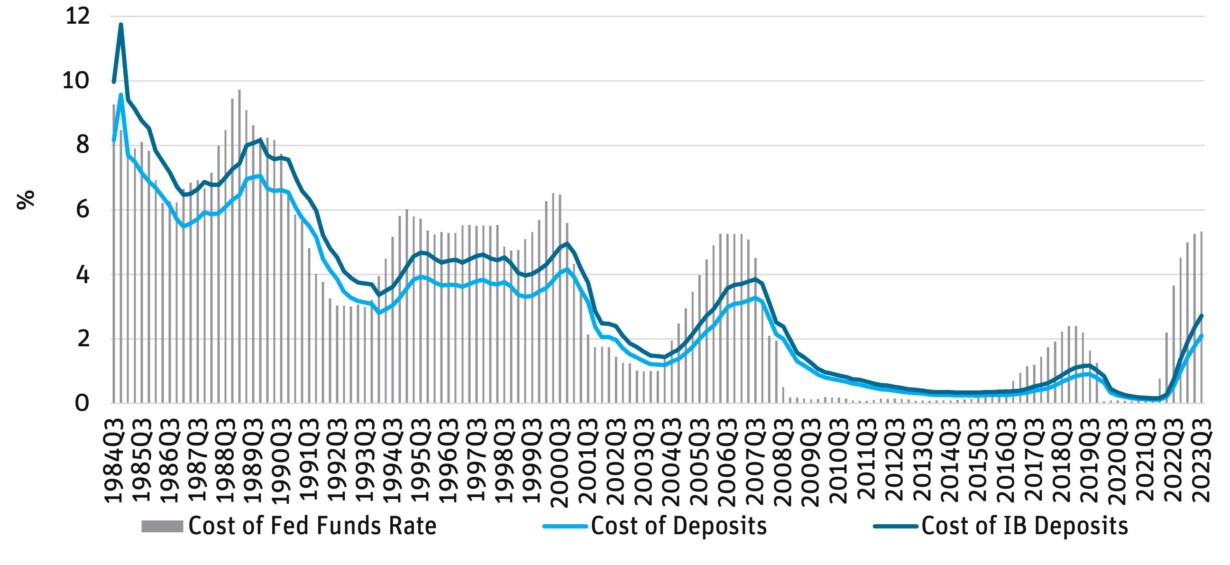
Source: Morgan Stanley Research, FDIC, Federal Reserve as of 9/30/23.
Credit Quality: Given the rapid rise in interest rates over the past several quarters and the ensuing pressure on consumer and corporate debt servicing capacity, credit will continue to normalize from today’s still-low levels. Consumer credit cycles play out faster than commercial credit cycles, and delinquencies have been increasing for both credit card and auto portfolios. Early signs from securitization trusts point to deceleration in the pace of delinquencies, and risk-adjusted margins remain positive.
Commercial real estate (CRE), and particularly office CRE, is a larger headwind; however, it is important to understand banks’ exposure to the CRE market. More than half of CRE resides outside the banking system, and banks tend to be more conservative underwriters in terms of cap rates and loan-to-values. With few exceptions, bank exposure to office CRE tends to be less than 5% of total loans. Over the course of 2023, banks have enhanced their disclosure on CRE portfolios and have built up loan loss reserves. While this CRE cycle will likely be more severe than prior cycles given the shift to increased work-from-home and hybrid work arrangements and there remains headline risk, overall, the banking sector is well reserved and well equipped to manage through deterioration in its CRE portfolios, particularly as CRE credit cycles tend to play out over multiple years.
Figure 5: Historically Low Credit Losses, High Reserves

Source: S&P Capital IQ Pro as of 9/30/23.
Figure 6: CRE Losses Historically Manageable Outside Of Construction Lending
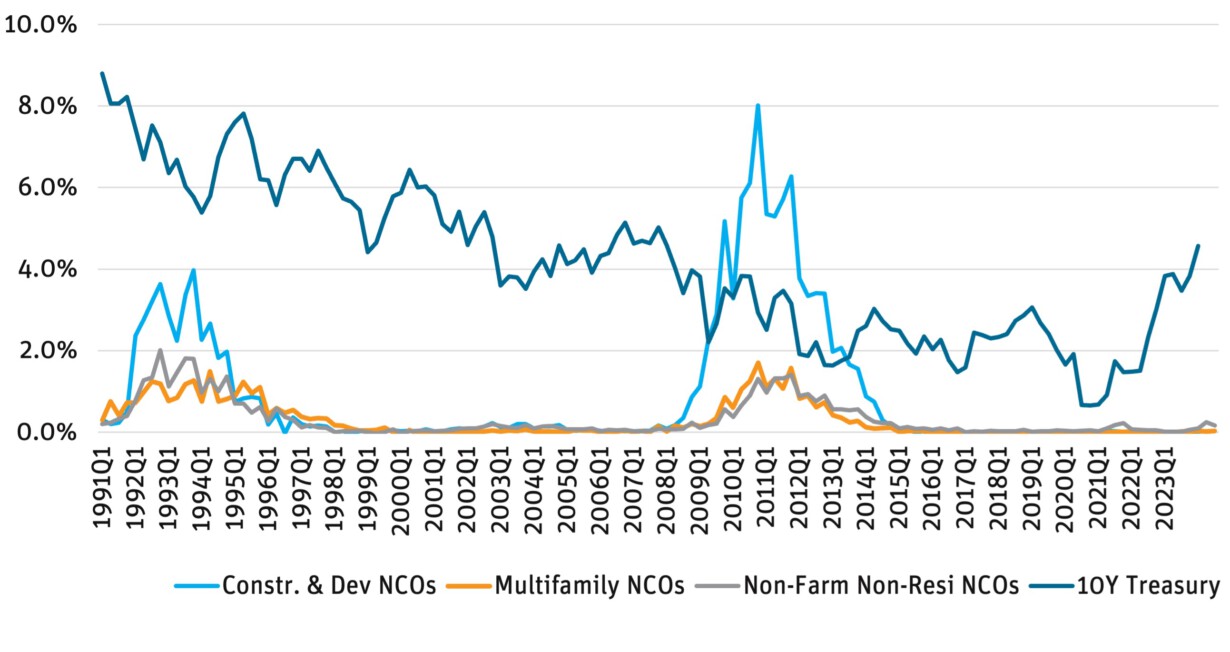
Source: Moody’s Investor Services, FDIC as of 9/30/23.
M&A: The banking sector is also grappling with elevated expenses, particularly related to increasing regulation and higher deposit costs. While the biggest changes from a tougher regulatory regime are expected for regional banks between $100 billion and $250 billion, all banks will need to operate under a stricter regime. Incremental costs relating to compliance, risk management, etc., will pressure bank expenses. Additionally, compensation costs account for the bulk of banks’ expense bases and technology remains a necessary investment, from both a cybersecurity and a competitive perspective. M&A activity should reaccelerate in 2024 after a slow 2023 as banks focus on improving scale and profitability. Cost savings from bank consolidation are tangible and meaningful, and they typically range from 20% to 30% of the acquired bank’s expense base.
Figure 7: Banking Sector M&A
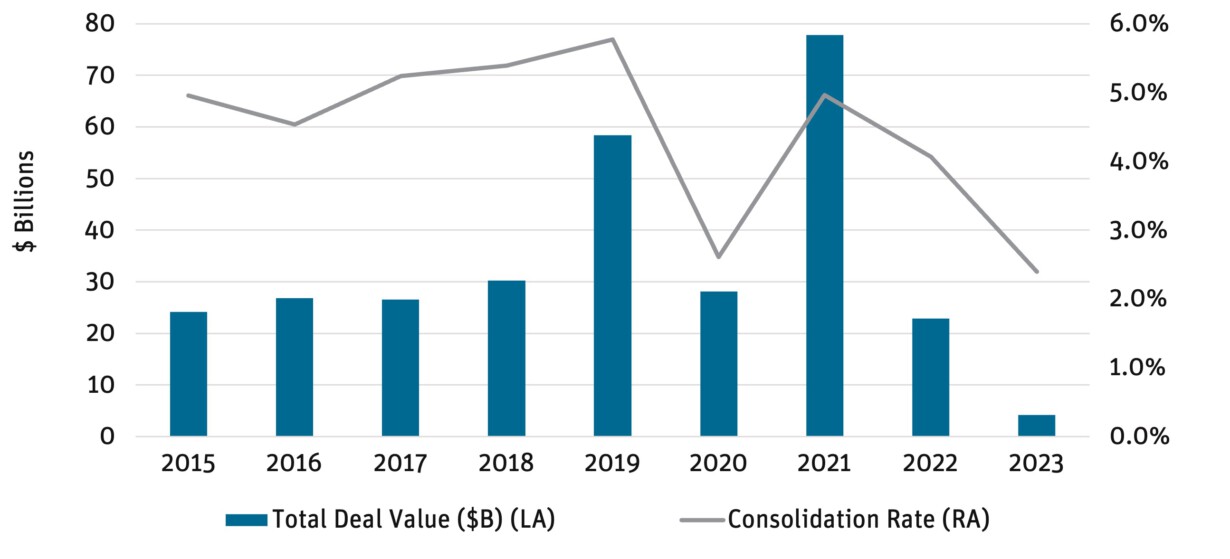
Source: S&P Capital IQ Pro as of 12/31/23.
Investment Opportunities
The opportunity set is attractive across the banking spectrum. Despite the recovery in bank equities in the fourth quarter of 2023, valuations remain muted. Additionally, spreads on bank debt remain at all-time wides, with little of the benefit from lower rates being reflected in pricing.
Debt: There is a fundamental mispricing of bank debt in the current market. The most typical instrument issued, subordinated debt (sub debt), is a Tier 2 regulatory capital instrument that is structured as a 10 no-call 5 fixed-to-float structure, meaning a 10-year final maturity, with the bond becoming callable and switching from fixed rate to floating rate at year 5. The key rationale for issuance is the regulatory capital treatment. Once there is less than 5 years to maturity, capital eligibility declines ratably over the last 5 years (i.e., 80% in year 6, 60% in year 7, etc.). The market is pricing these bonds assuming they will be outstanding until maturity. We believe this is fundamentally incorrect. While banks are unlikely to issue below current yields, banks issue these bonds for capital purposes rather than funding purposes. Banks can fund themselves much more efficiently through alternative sources, mainly deposits. Thus, the key consideration for calling a bond and issuing new sub debt hinges on the effective cost of capital. While a case can be made for keeping these bonds outstanding for a year or two following the initial call, the debt becomes expensive funding past that point.
Figure 9:
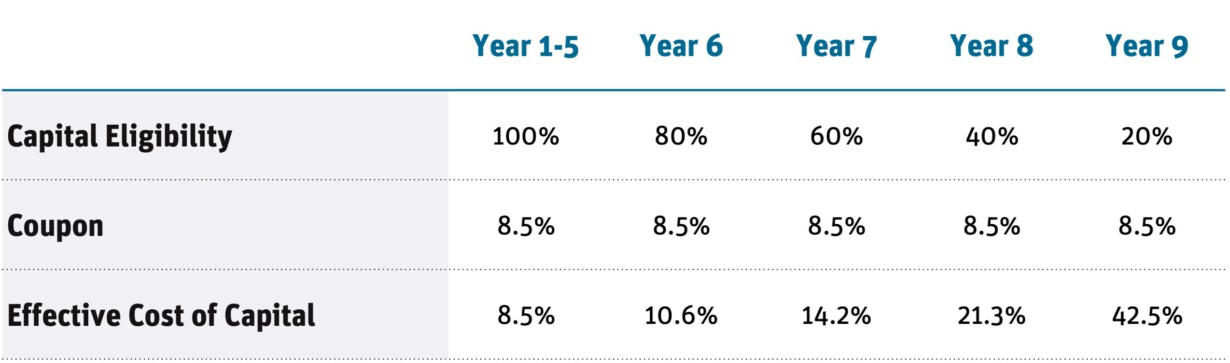
Source: Angel Oak Capital as of 12/31/23.
Exacerbating the dislocation in the bank debt market, primary issuance was de minimis in 2023. By contrast, 106 deals came to market in 2022 for a total of $4.4 billion, 215 deals came in 2021 for $8.5 billion, and 217 deals came in 2020 for $11 billion. Issuance in 2023 was negatively impacted both by issuers’ reluctance to issue at current market rates given the rise in interest rates, coupled with historically wide spreads, and by investors’ hesitance to invest in the sector given potential contagion risk from the regional bank failures in 1H33. This is similar to the dynamics in 2020, when the primary market shut down during the COVID-19 pandemic. Upon reopen, there was a flurry of activity, resulting in the highest single-year issuance for community bank debt since inception.
Figure 10: Bank Debt Primary Market Issuance
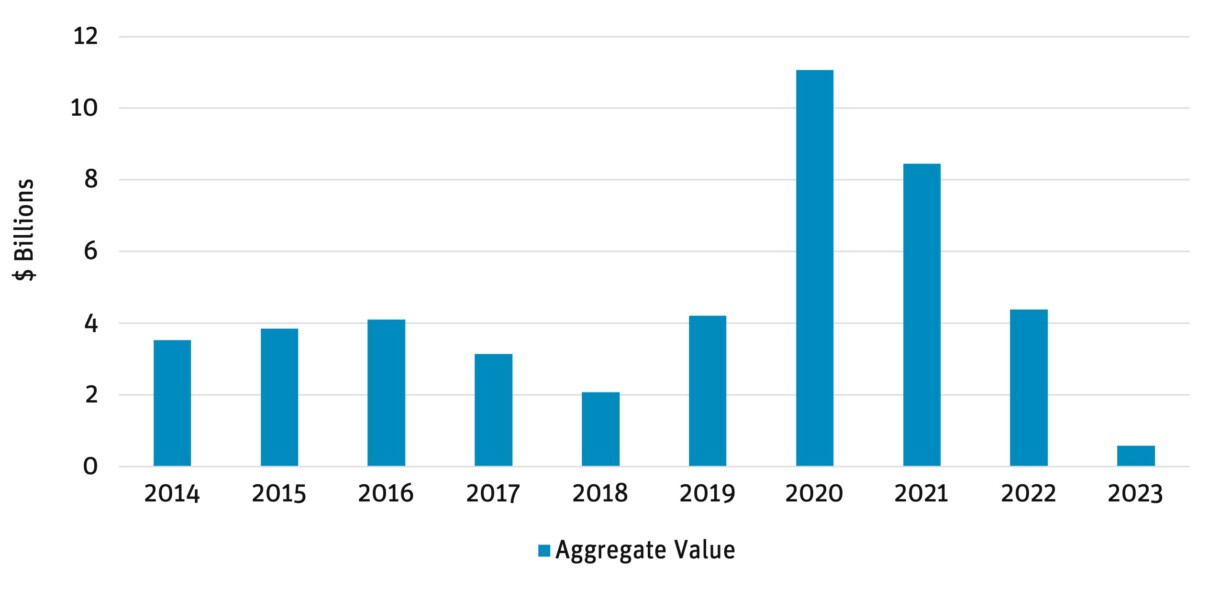
Source: Piper Sandler, KBW, Performance Trust as of 12/31/23. 2023 Issuance includes senior debt issuances.
We are optimistic that the primary issue market will reemerge with strength in 2024 for several reasons. First, $1.8 billion of community bank debt is maturing and we fully expect most of these banks will have to refinance those notes as they come due. Secondly, there is an additional $2 billion of debt outstanding that is already in the floating rate period. These bonds have had their coupons reset higher and are losing regulatory capital eligibility at 20% per year, rendering the debt expensive and inefficient. Finally, approximately $4 billion of debt will enter the call/floating rate period this year. A robust primary market should also guide the secondary market, driving attractive investment opportunities across the community bank debt landscape.
Equities: Bank equities are cheap by any measure, as a lack of conviction around the pace of rate cuts and the depth of credit normalization has been keeping investors on the sidelines. As more clarity emerges in 1H34, bank equities could offer investors compelling upside. We favor community banks with strong deposit franchises, attractive footprints, and beneficiaries of an upcoming M&A cycle.
Figure 11: Bank Relative P/E Multiples
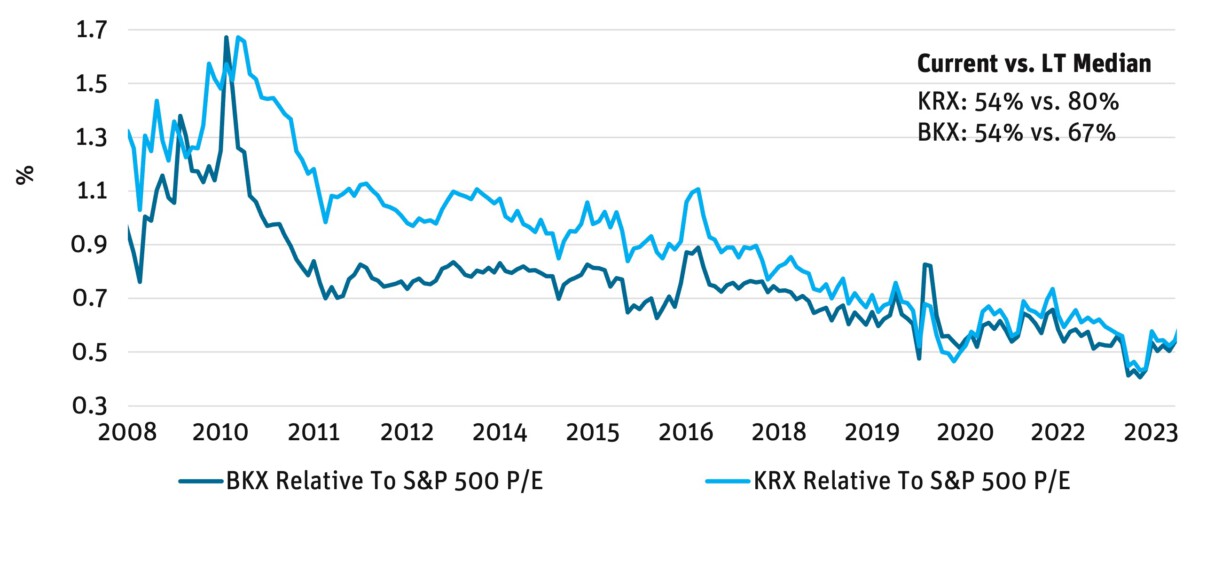
Source: KBW Research, FactSet, Bloomberg as of 12/31/23.
Figure 12: Bank P/TBV Multiples

Source: KBW Research, FactSet, Bloomberg as of 12/31/23.
Definitions And Disclosures
Accumulated Other Comprehensive Income (AOCI): Includes unrealized gains and losses that are reported in the equity section of the balance sheet.
Angel Oak Community Bank Index: Tracks spreads on a homogeneous portion of the community bank sub-debt market.
Community Bank Sub-Debt: Subordinated debentures of financial institutions with total assets of less than $20 billion.
Interest Rate on Reserve Balances (IORB): The interest rate paid by the Federal Reserve on balances maintained by or on behalf of an eligible institution in an account at a Federal Reserve Bank.
KBW Bank Index (BKX): The index is designed to track the performance of the leading banks and thrifts that are publicly-traded in the U.S.
KBW Regional Banking Index (KRX): The index seeks to reflect the performance of U.S. companies that do business as regional banks or thrifts.
NASDAQ ABA Community Bank Index (QABA): A market capitalization-weighted index designed to track the performance of banks and thrifts, or their holding companies, listed on The NASDAQ Stock Market.
NCO: Net charge-off.
NPA: Non-performing asset.
NPA Ratio: A ratio used to measure the overall quality of a bank’s loan book.
Price/Earnings (P/E) Ratio: The ratio of a company’s stock price to the company’s earnings per share.
Price-To-Tangible Book Value (P/TBV) Ratio: A financial ratio used to compare a company’s current market price to its book value.
S&P 500 Total Return Index (SPX): The index is widely regarded as the best single gauge of large-cap U.S. equities and serves as the foundation for a wide range of investment products. The index includes 500 leading companies and captures approximately 80% coverage of available market capitalization.
Tier 2 Capital: A bank’s supplementary capital including evaluation reserve, undisclosed reserves, hybrid security, and subordinate debt.
It is not possible to invest directly in an index.
Must be preceded or accompanied by a prospectus. To obtain an electronic copy of the prospectus, please visit www.angeloakcapital.com. Opinions expressed are as of 12/31/23 and are subject to change at any time, are not guaranteed, and should not be considered investment advice.
Investing involves risk; principal loss is possible. Investments in debt securities typically decrease when interest rates rise. This risk is usually greater for longer-term debt securities. Investments in lower-rated and nonrated securities present a greater risk of loss to principal and interest than do higher-rated securities. Investments in asset-backed and mortgage-backed securities include additional risks that investors should be aware of, including credit risk, prepayment risk, possible illiquidity and default, as well as increased susceptibility to adverse economic developments. Derivatives involve risks different from — and in certain cases, greater than — the risks presented by more traditional investments. Derivatives may involve certain costs and risks such as illiquidity, interest rate, market, credit, management and the risk that a position could not be closed when most advantageous. Investing in derivatives could lead to losses that are greater than the amount invested. The Fund may make short sales of securities, which involves the risk that losses may exceed the original amount invested. The Fund may use leverage, which may exaggerate the effect of any increase or decrease in the value of securities in the Fund’s portfolio or the Fund’s net asset value, and therefore may increase the volatility of the Fund. Investments in foreign securities involve greater volatility and political, economic and currency risks and differences in accounting methods. These risks are increased for emerging markets. Investments in fixed-income instruments typically decrease in value when interest rates rise. The Fund will incur higher and duplicative costs when it invests in mutual funds, ETFs and other investment companies. There is also the risk that the Fund may suffer losses due to the investment practices of the underlying funds. For more information on these risks and other risks of the Fund, please see the Prospectus.
Index performance is not indicative of Fund performance. Past performance does not guarantee future results. Current performance can be obtained by calling 855-751-4324. As of 12/31/23, no securities mentioned were held by the Angel Oak Funds. The Angel Oak Funds are distributed by Quasar Distributors, LLC. © 2024 Angel Oak Capital Advisors, which is the adviser to the Angel Oak Funds.