All Aboard!
This year is setting up to be one of the best opportunities for bank investors that we can recall. Fundamentally, banks should benefit from falling deposit costs, stronger loan growth, and moderating credit concerns against a backdrop of strong profitability. Additionally, the incoming Trump administration likely will enact a lighter-touch regulatory regime as well as a more streamlined mergers and acquisitions (M&A) process geared toward accelerating bank consolidation. Finally, after a dearth of primary market issuance over the past two years, given the rapid rise in interest rates and the spring 2023 regional banking crisis, the bank debt market is poised for significant issuance in 2025, helped by over $10 billion of subordinated debt moving into its floating rate/call period. On the equities side, banks have given up much of the November Trump bounce and present a compelling entry point to invest at historically discounted relative multiples into a higher earnings growth environment.
Building on 2024’s Strong Performance in 2025
The banking industry started 2024 in recovery mode, following the spring 2023 regional banking crisis, which led banks to emphasize liquidity, almost regardless of cost. As contagion risk and funding fears eased entering 2024, credit concerns started to surface, dominating the conversation, especially after New York Community Bancorp reported a large quarterly loss due to deterioration in its multifamily and office commercial real estate (CRE) portfolios. By early March, however, the bank announced that it had raised more than $1 billion in equity from a consortium of private equity investors. While regional banks underperformed significantly to start the year as credit concerns arose, from April through year-end, regional bank equities surged, generating a total return of nearly 25%, outpacing the S&P 500’s 16% return for that same period.
Figure 1: 2024 Performance – Banks Outperformed Beginning in April
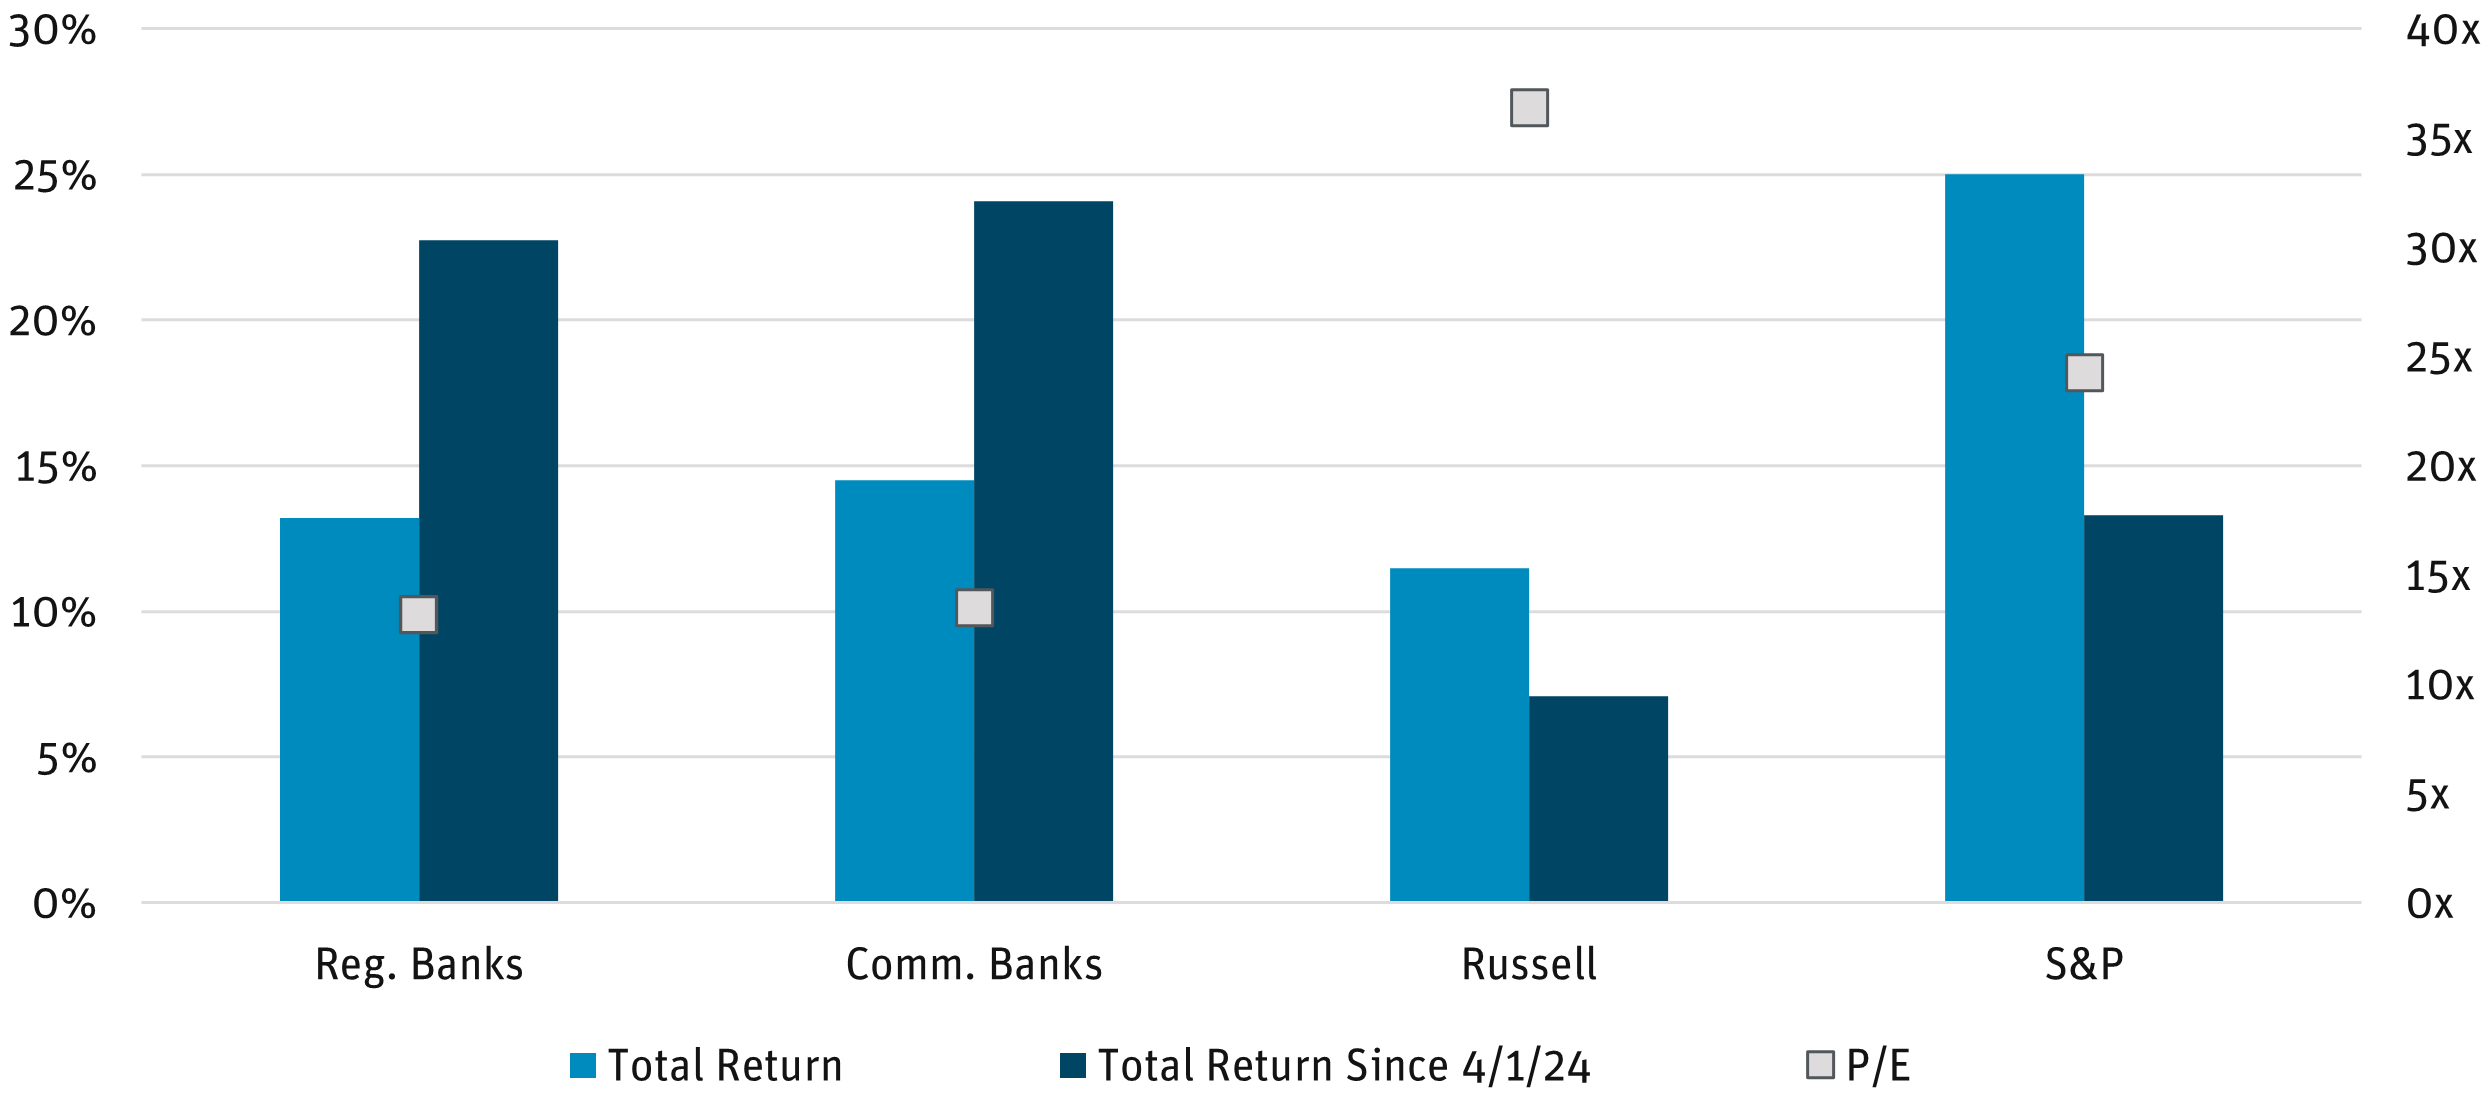
Source: Bloomberg as of 12/31/24. Regional banks are represented by the KRX Index and community banks are represented by the QABA Index Fund.
For the full year 2024, both community and regional banks rebounded following two years of negative returns. The NASDAQ OMX ABA Community Bank Index (QABA) ended 2024 up 15.24%, while the larger KBW Regional Banking Index (KRX) returned 13.20%. Banks showed strong performance compared with the Russell 2000, despite falling short of the S&P’s 25.02% return on a full-year basis. Notwithstanding 2024 performance, bank stocks’ multiyear relative underperformance presents a compelling opportunity to invest in the sector at historically discounted multiples compared with the broader market. At year-end, the KRX’s and the QABA’s price-to-earnings (P/E) multiple was nearly half that of the S&P 500. This year should benefit not only from earnings growth as net interest income inflects positively but also multiple expansions as investor confidence rebounds.
Figure 2: QABA and KRX Rel. P/E to SPX
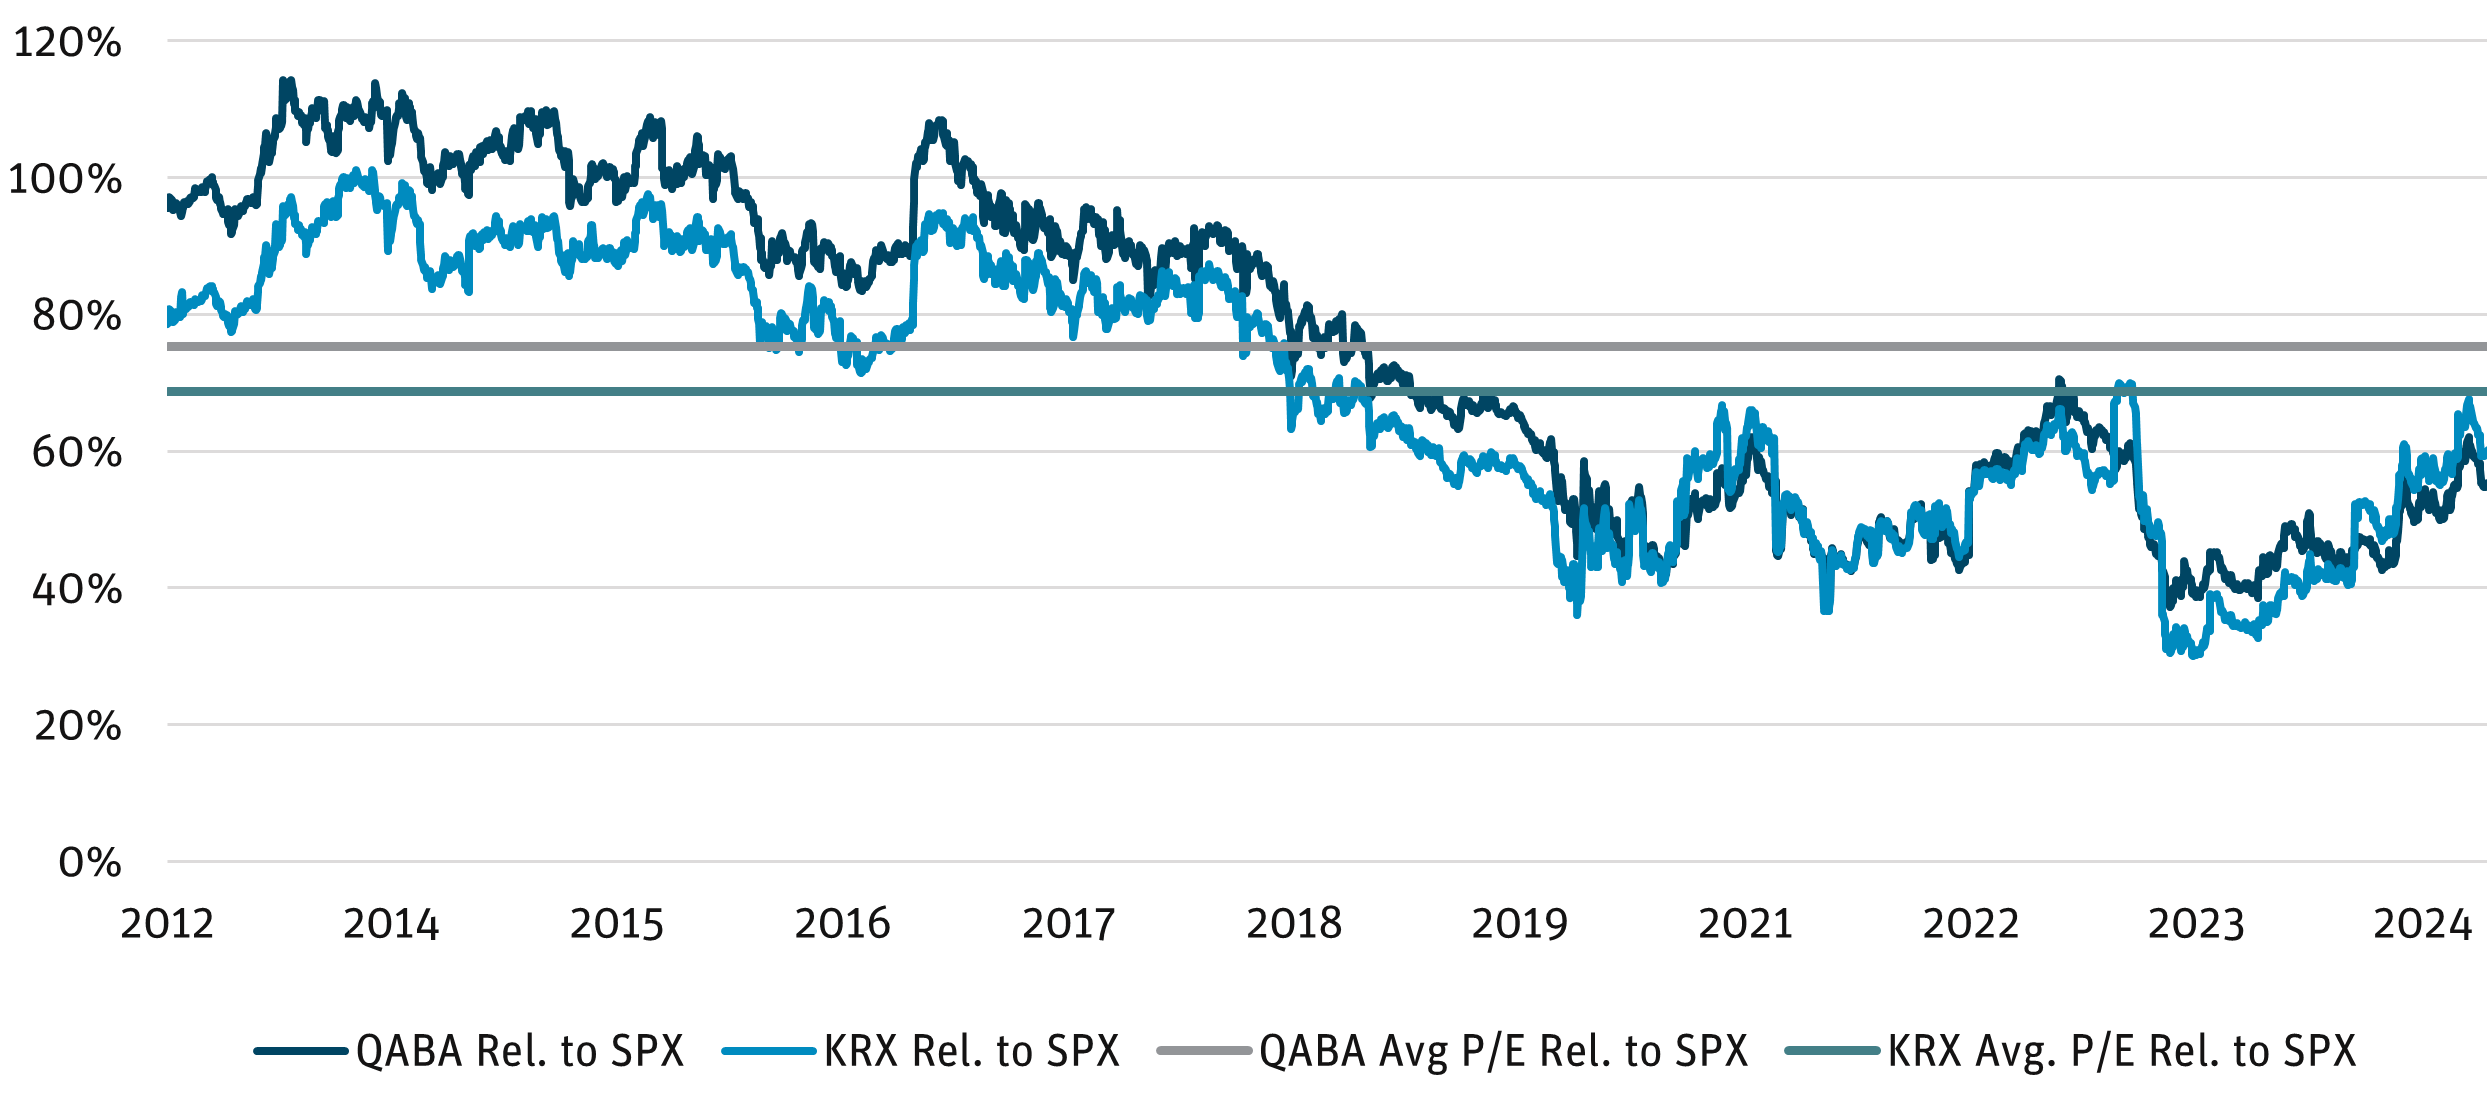
Source: Bloomberg as of 12/31/24.
Bank debt also saw strong performance in 2024, as spreads normalized down toward the historical average of 363 basis points (bps) as of December 31, 2024, compared with 438 bps on January 1, 2024, and the historical average of 332 bps. Despite just $3 billion of primary issuance in 2024 as the market began to reopen in the second half of 2024, there is reason for optimism in 2025 for more robust issuance, as more than $3 billion of debt is maturing, another $2 billion of debt is already in its floating rate/call period, and over $10 billion will enter its floating rate/call period in the next 12 months. We expect most banks will refinance their maturing debt, and the decision point between refinancing versus leaving bonds floating at a higher rate with lower capital eligibility (subordinated debt bonds lose regulatory Tier 2 capital eligibility at 20% per year when the term to maturity is less than five years) should become more financially viable as rates decline, particularly given the high back-end spreads on the 2020 vintage that is repricing in 2025.
Figure 3: Angel Oak Community Bank Composite Index
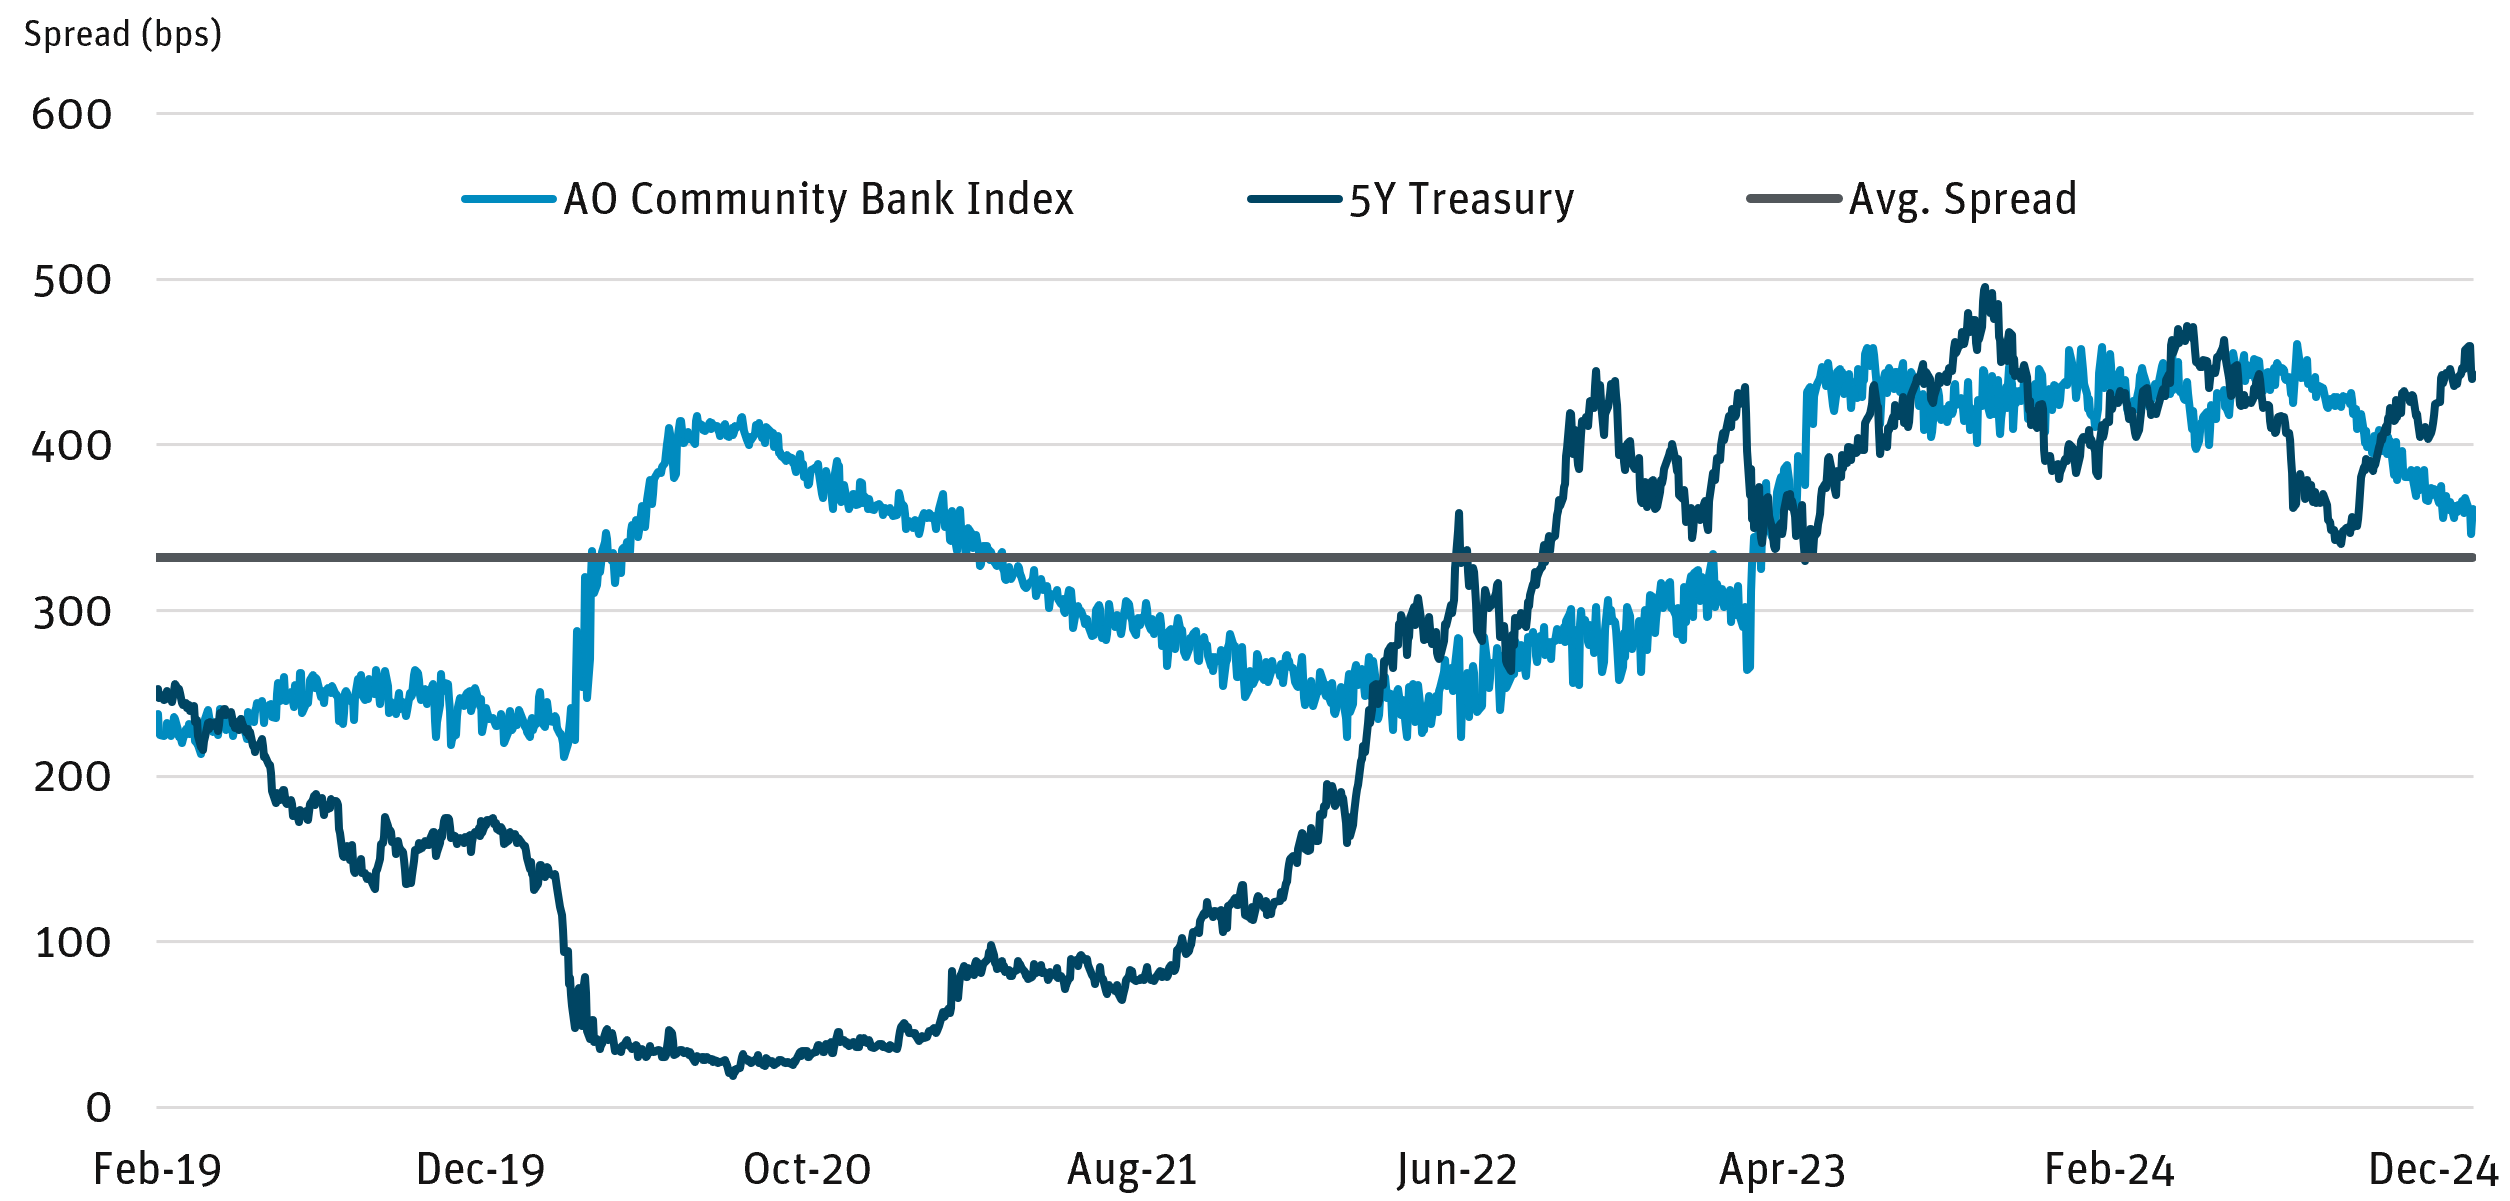
Source: AOCA as of 12/31/24.
Figure 4: 2025 Repricing Schedule for 2020 Vintage Issuance

Source: AOCA, Piper Sandler, KBW, Performance Trust as of 12/31/24.
Positioned for Success
Banks are poised for earnings growth in 2025 after a couple of tough years grappling with rapidly rising rates and liquidity pressures. The rapid rise in interest rates beginning in 2022 pressured net interest margins (NIM) and drove unrealized losses in securities portfolios. The regional banking crisis in spring 2023 layered on liquidity and funding concerns, pressuring deposit costs even further. Additionally, banks with outsized CRE concentrations have faced strong regulatory pressure to lower exposure below 300% of regulatory capital. Banks have spent the past couple of years strengthening balance sheets with a host of actions, including diversifying funding sources; reducing reliance on uninsured deposits; repositioning securities portfolios; selling loan portfolios, noncore assets, and securities; and engaging in other capital optimizing activities such as sale leasebacks and bank-owned life insurance restructuring.
With balance sheets now well positioned and capital levels strong, banks are turning back to the core business of banking under a more positive macro backdrop. The Federal Reserve has cut interest rates by 100 bps, with another one to four cuts potentially on deck for 2025; the yield curve has steepened; the labor market remains resilient; and the consumer is in good shape. Additionally, the Trump administration is likely to enact a lighter-touch regulatory regime as well as a more streamlined M&A process geared toward accelerating bank consolidation.
Falling deposit costs, accelerating loan growth, and easing credit concerns will provide upside to earnings and multiples in 2025. Additionally, higher earnings power coupled with a lighter-touch regulatory environment could drive higher share buyback activity.
Revenue Growth: In the near term, we expect NIM to inflect higher as banks cut deposit rates and pay down higher costs of funding in a stilltepid loan growth environment. In addition to lower funding costs, asset yields should benefit from both fixed- and floating-rate loan repricings and securities book repricing. The regional banks should see an outsized benefit from repricings on both sides of the balance sheet, as they bore the brunt of the deposit pricing pressure following the spring 2023 crisis, and they have more fixed-rate assets originated in 2021/2022, when rates were much lower. Loan growth should accelerate over the course of 2025 given recent rate cuts and improved post-election confidence. We anticipate that loan growth will improve to mid-singledigit levels over the next few quarters. Finally, the money center banks should also benefit from a rebound in capital markets activities. A lowerrate, soft-landing environment should drive higher fee income in areas like M&A and equity capital markets.
Figure 5: NIM Inflection as Deposit Costs Improve
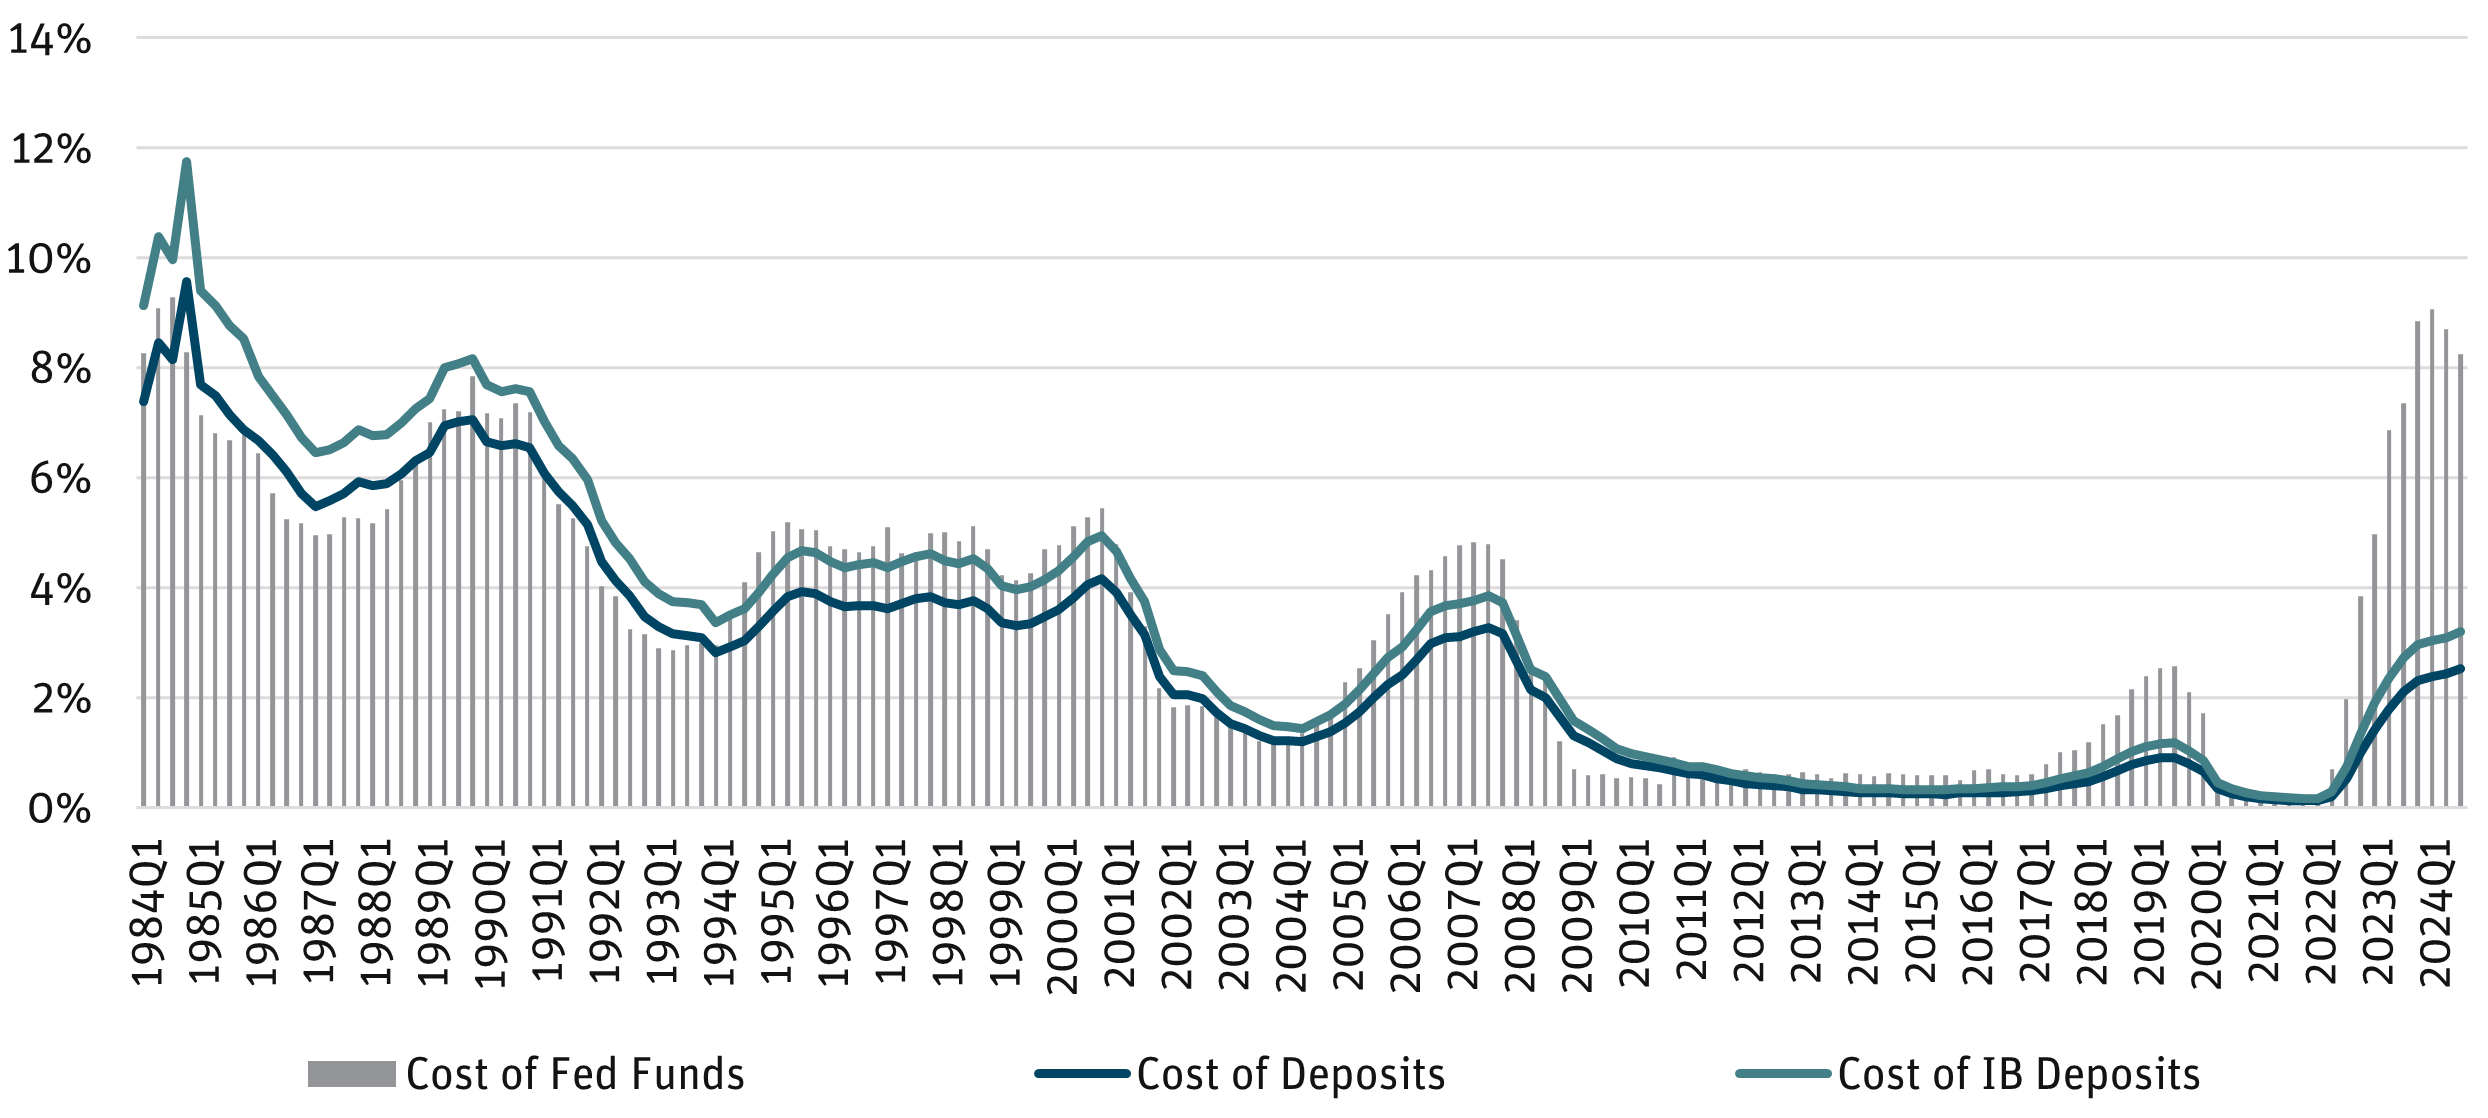
Source: FDIC, Federal Reserve as of 12/31/24.
Operating Leverage: This should also improve over the course of 2025. Banks have become very efficient operators given the rate environment and inflationary pressures over the past few years. We expect revenue growth will outstrip expense growth over the next couple of years, helped particularly by NIM expansion.
Credit Costs: While we expect continued credit normalization off a stilllow base, lower interest rates are credit positive, particularly for the lower income/lower FICO consumer cohort. Banks have built up loan loss reserves over the past few years and will have higher earnings growth to cover new credit problems going forward. We remain mindful of potential idiosyncratic issues in CRE, office CRE in particular, but we note that (1) bank exposure to office CRE is manageable in the context of highly diversified loan portfolios, (2) banks have been reducing CRE exposure toward the regulatory guidance of 300% of capital through strategic actions, and (3) CRE borrowers are likely to bring in equity/mezzanine financing to extend their loans in a lower-rate environment. Commercial and industrial and consumer net charge-offs (NCOs) likely will peak in the first half of 2025 and move lower in the back half of the year.
Figure 6: Lower Rates are Credit Positive
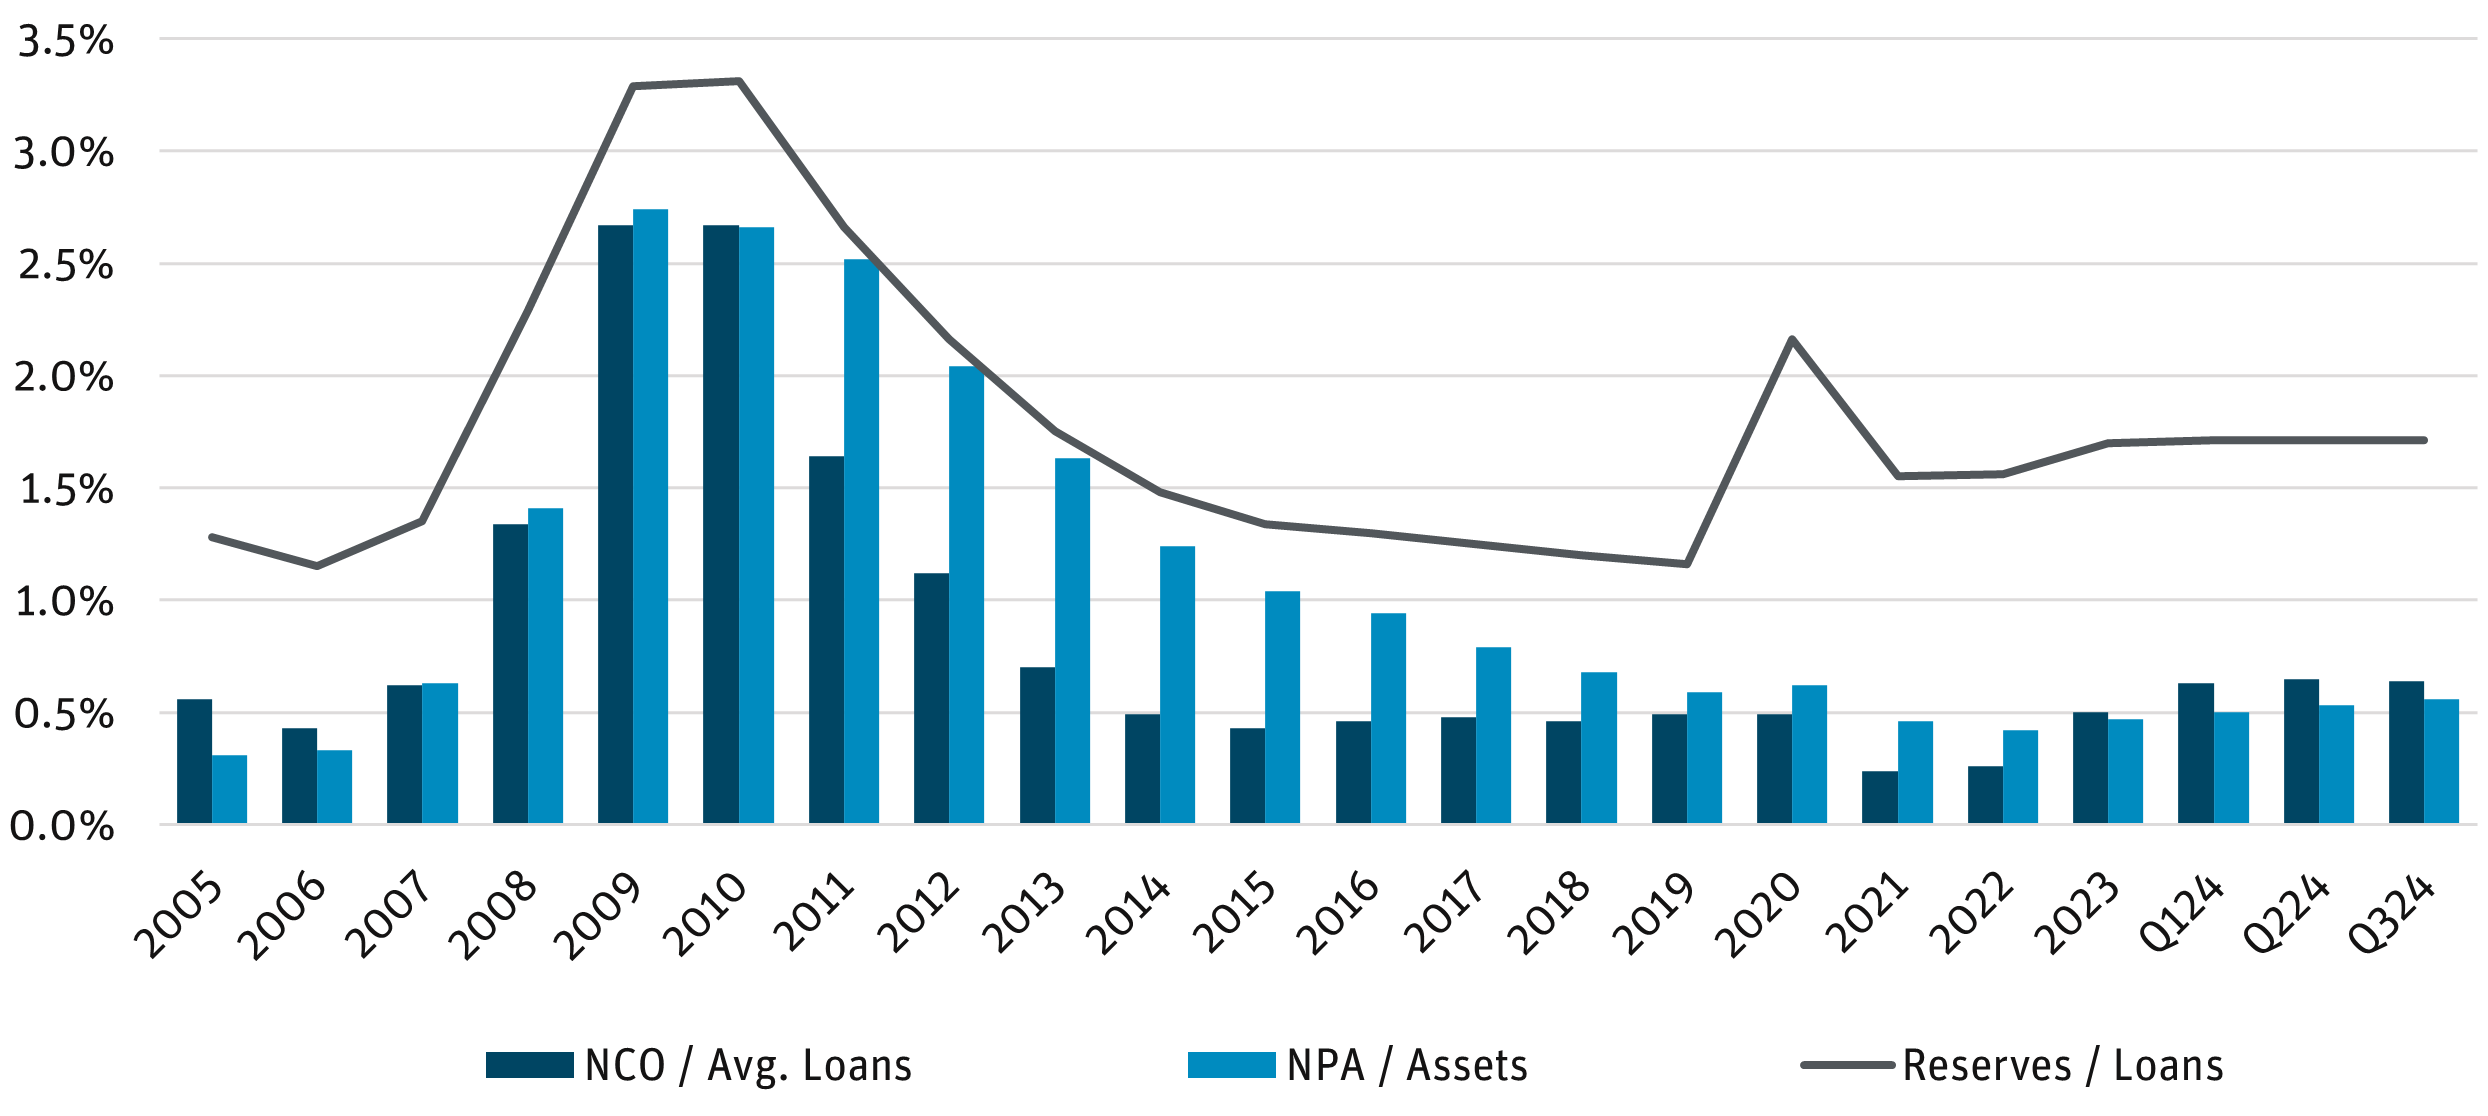
Source: S&P Capital IQ Pro as of 12/31/24.
The Return of M&A
Following several years of muted deal activity, bank executives and investors are positioning for a sharp uptick in consolidation activity. While industry multiples are still rebounding, M&A were below historical averages in both 2023 — not surprising, given the liquidity crisis — and 2024, though activity picked up beginning in the fall, particularly for “mega mergers” (deal size over $500 million). Optimism related to the incoming bank-friendly administration, with expectations for a lightertouch regulatory backdrop, could spur more mergers, enabling the consolidation rate to revert to its longer-term average of 5% or higher.
Figure 7: Banking Sector Consolidation Rate
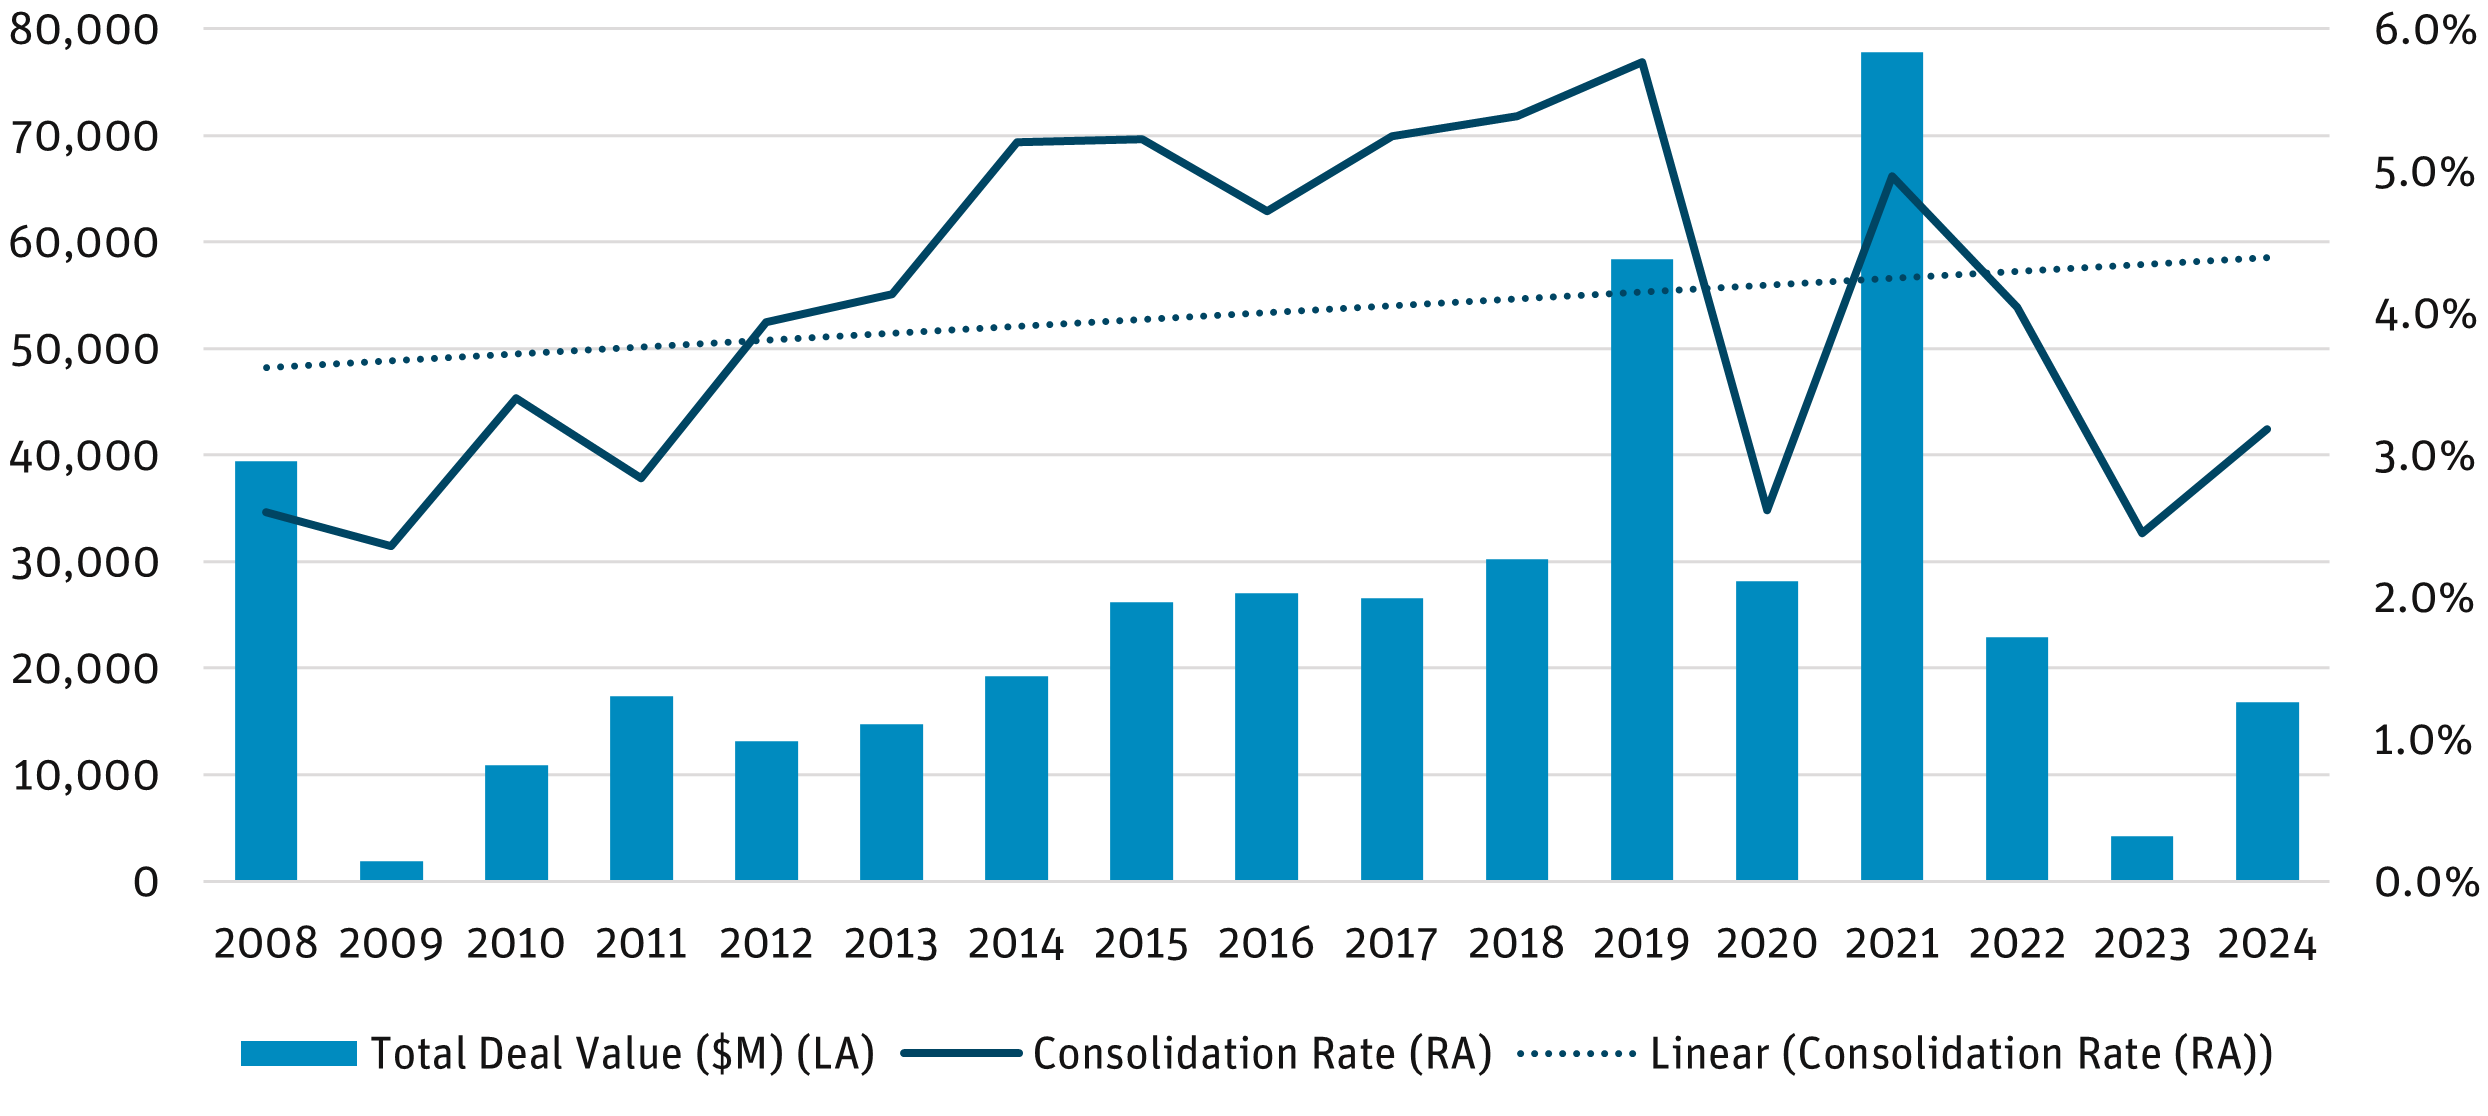
Source: S&P Capital IQ Pro as of 12/31/24.
Figure 8: Largest M&A Transactions of 2024
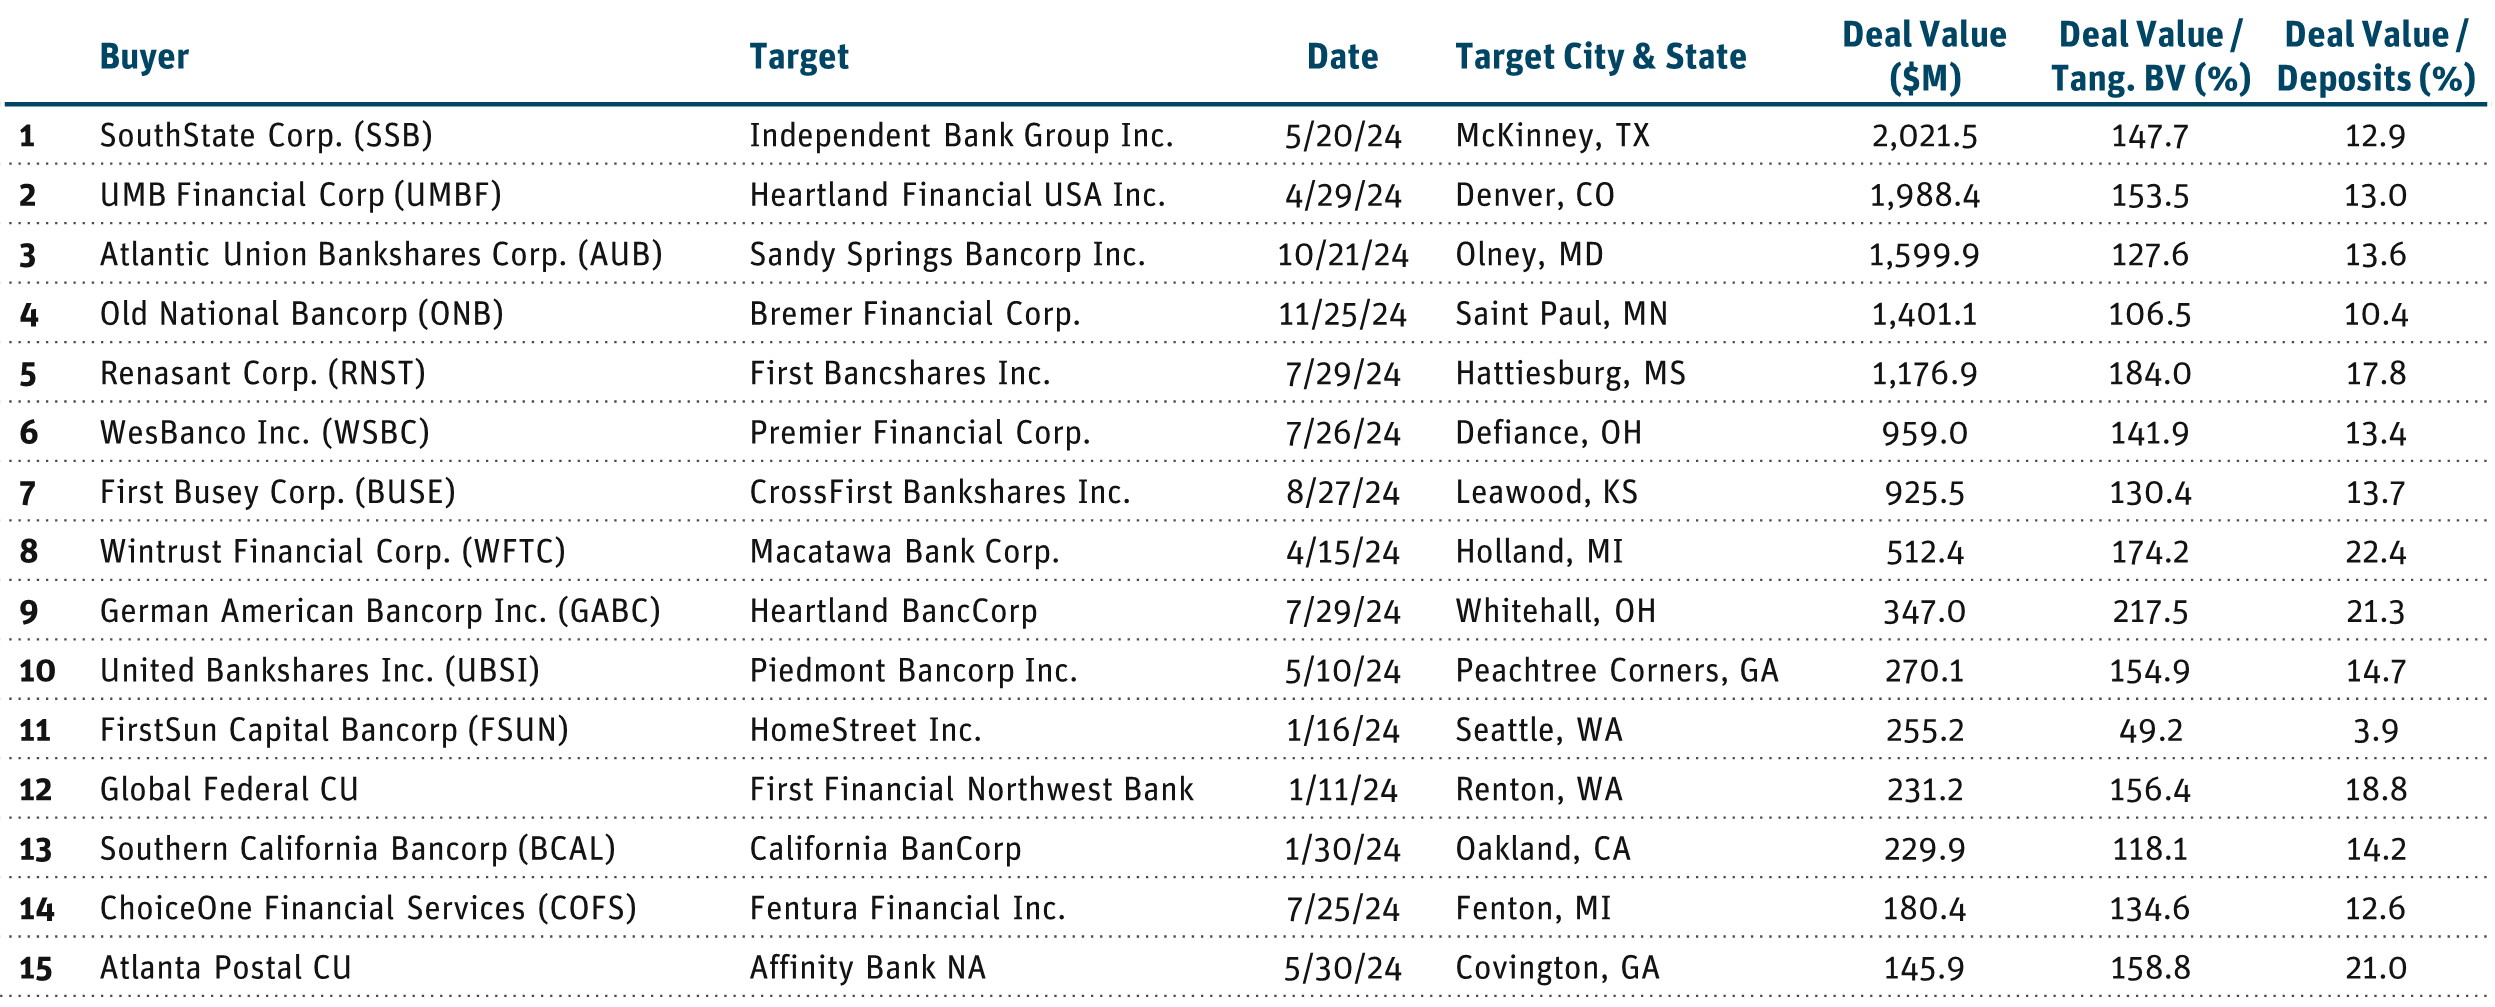
Source: S&P Capital IQ Pro as of 12/31/24.
Extended deal closings have been a major sticking point for both buyers and sellers. From 2017 to 2020, bank deals took 187 days to close, compared with a median of 265 days from 2021 to 2023. And for a larger sample size, from 2009 to 2016, the median deal closing took 255 days, implying that bank deals closed 43% more quickly during a Republican administration. Even ahead of the transition to the new administration, we take note of positive anecdotal evidence; a large merger-of-equals in the D.C. area recently received approval in only three months. In addition to a shift in regimes, this suggests banks are more proactive in managing the process, including raising capital or selling assets ahead of deal closing. Pent-up demand from prior years should signal a return to merger activity, and a more favorable streamlined regulatory framework would only help spur deals in the space.
Investment Opportunities
We are perhaps more bullish on the financial sector than we have ever been as we enter 2025. Fundamentally, financial services companies, banks in particular, are well positioned to drive earnings growth and multiple expansion as the rate environment moves from a headwind to a tailwind. Additionally, balance sheets have been strengthened over the past couple of years, and strategic actions such as loan and securities sales, sale leasebacks, and non-core business line exits have improved investor confidence in the sector. Finally, the Trump administration is viewed as bank-friendly and will likely enact a lighter-touch regulatory regime as well as a more streamlined M&A process geared toward accelerating bank consolidation. We view the opportunity set as attractive across the banking spectrum and look for outperformance in both bank debt and bank equities relative to investment-grade credit and other S&P equity sectors.
Bank Debt: After a dearth of primary market issuance over the past two years, the bank debt market is poised for significant issuance in 2025, helped by over $10 billion of community bank debt moving into its floating rate/call period this year, in addition to roughly $5 billion of debt either already in its call period (regulatory capital treatment is declining at 20% per year) or maturing this year. As spreads have tightened back toward historical averages with a return of investor confidence and a positive macro backdrop, primary issuance makes sense from both financial and regulatory capital perspectives. The 2020 issuance vintage in particular has large back-end spreads, given postCOVID-19 issuance dynamics, so it will make sense to refinance at a lower overall cost, particularly if the Fed continues to cut rates.
Additionally, as bank M&A reaccelerate in a friendlier regulatory regime, there is incremental upside to bank debt from a total return perspective in 2025. Bank M&A have been an alpha generator given the trend for smaller banks being acquired by larger banks. Subordinated debt is not cancelable and is assumed by the acquiring institution. Historically, this has resulted in spread tightening and price appreciation in the smaller bank’s bonds, driving excess total return.
Bank Equities: While bank equities rallied on the Republican sweep in November, much of the gain faded into year-end. As we entered fourthquarter 2024 earnings season, banks have delivered relative to expectations in terms of (1) a capital markets rebound, (2) NIM expansion, and (3) still-benign but normalizing credit costs. Adding improving loan growth and operating leverage dynamics as we move through 2025 should drive both higher earnings growth and multiple expansions as investor confidence continues to rebound. Valuations remain cheap on an absolute and relative basis — at year-end, the KRX’s and the QABA’s P/E multiple was nearly half that of the S&P 500 — driving a compelling entry point for investors.
Definitions And Disclosures
5-Year Treasury Index: A one-security index comprising the most recently issued 5-year U.S. Treasury note or bond.
Alpha: Measures the difference between a fund’s actual returns and its expected performance, given its level of risk (as measured by beta). A positive alpha figure indicates the fund has performed better than its beta would predict. In contrast, a negative alpha indicates a fund has underperformed, given the expectations established by the fund’s beta.
Angel Oak Community Bank Index: Tracks spreads on a homogeneous portion of the community bank sub-debt market.
Community Bank Sub-Debt: Subordinated debentures of financial institutions with total assets of less than $50 billion.
FICO: Fair Isaac Corporation.
Floating Rate: A floating-rate security is an investment with interest payments that float or adjust periodically based upon a predetermined benchmark.
KBW Regional Banking Index (KRX): The index seeks to reflect the performance of U.S. companies that do business as regional banks or thrifts.
NASDAQ OMX ABA Community Bank Index (QABA): A market capitalization- weighted index designed to track the performance of banks and thrifts, or their holding companies, listed on The NASDAQ Stock Market.
Net Interest Income (NII): The difference between the revenue generated from a bank’s interest-bearing assets and expenses incurred while paying its interest- bearing liabilities.
Net Interest Margin (NIM): An industry-specific profitability ratio for banks and other financial institutions. It is a measure of the spread a bank earns between interest income and the amount of interest paid out to its depositors, expressed as a percentage of earning assets.
NPA: Non-performing asset.
Price/Earnings (P/E) Ratio: The ratio of a company’s stock price to the company’s earnings per share.
Russell 2000 Index: A stock market index that measures the performance of the 2,000 smaller companies included in the Russell 3000 Index.
S&P 500 Total Return Index (SPX): The index is widely regarded as the best single gauge of large-cap U.S. equities and serves as the foundation for a wide range of investment products. The index includes 500 leading companies and captures approximately 80% coverage of available market capitalization.
Spread: The difference in yield between a U.S. Treasury bond and a debt security with the same maturity but of lesser quality.
Tier 2 Capital: A bank’s supplementary capital including evaluation reserve, undisclosed reserves, hybrid security, and subordinate debt.
Yield Curve: The U.S. Treasury yield curve refers to a line chart that depicts the yields of short-term Treasury bills compared to the yields of long-term Treasury notes and bonds. The slope, shape, and level of yield curves may vary over time with changes in interest rates.
It is not possible to invest directly in an index.
Must be preceded or accompanied by a prospectus. To obtain an electronic copy of the prospectus, please visit www.angeloakcapital.com.
Opinions expressed are as of 12/31/24 and are subject to change at any time, are not guaranteed, and should not be considered investment advice.
Investing involves risk; principal loss is possible. Investments in debt securities typically decrease when interest rates rise. This risk is usually greater for longer-term debt securities. Investments in lower-rated and nonrated securities present a greater risk of loss to principal and interest than do higher-rated securities. Investments in asset-backed and mortgage-backed securities include additional risks that investors should be aware of, including credit risk, prepayment risk, possible illiquidity and default, as well as increased susceptibility to adverse economic developments. Derivatives involve risks different from — and in certain cases, greater than — the risks presented by more traditional investments. Derivatives may involve certain costs and risks such as illiquidity, interest rate, market, credit, management and the risk that a position could not be closed when most advantageous. Investing in derivatives could lead to losses that are greater than the amount invested. The Fund may make short sales of securities, which involves the risk that losses may exceed the original amount invested. The Fund may use leverage, which may exaggerate the effect of any increase or decrease in the value of securities in the Fund’s portfolio or the Fund’s net asset value, and therefore may increase the volatility of the Fund. Investments in foreign securities involve greater volatility and political, economic and currency risks and differences in accounting methods. These risks are increased for emerging markets. Investments in fixed-income instruments typically decrease in value when interest rates rise. The Fund will incur higher and duplicative costs when it invests in mutual funds, ETFs and other investment companies. There is also the risk that the Fund may suffer losses due to the investment practices of the underlying funds. For more information on these risks and other risks of the Fund, please see the Prospectus.
Index performance is not indicative of Fund performance. Past performance does not guarantee future results. Current performance can be obtained by calling 855-751-4324.
As of 12/31/24, no securities mentioned were held by the Angel Oak Funds.
The Angel Oak Funds are distributed by Quasar Distributors, LLC.
© 2025 Angel Oak Capital Advisors, which is the adviser to the Angel Oak Funds.