BORING IS THE NEW ALPHA
We expect 2026 to deliver another year of strong outperformance for the U.S. banking sector, extending the momentum from 2025, when we were perhaps the most bullish that we have ever been on banks. Following the ever-tightening regulatory trend that has persisted since the global financial crisis, aside from a brief reprieve during the first Trump administration, we have entered a new era of bank regulation.
Fundamentally, banks should benefit from:
- Strong revenue growth, driven by expanding net interest income (NII) and a continued rebound in capital markets activity;
- Greater capital deployment and optimization under a lighter-touch regulatory regime; and
- A credit-positive macro backdrop as rate cuts continue.
In 2025, bank debt issuance saw a major resurgence, marking the third-strongest year on record for the regional and community bank debt market, with nearly $8 billion issued. We expect similarly strong volumes in 2026, supported by robust investor demand, a healthy pipeline, and a broadening investor base.
We also anticipate the environment will be constructive for regional and community bank equities, and the historically discounted relative multiples, the widest in over a decade, offer an attractive entry point to smaller bank equities.
PIVOT TO “BORING”
“Bigger” dominated in 2025, as large-cap bank stocks surged, outperforming smaller peers and most major domestic equity indices. The KBW Bank Total Return Index (BKX) delivered a 32.6% total return, extending 2024’s strong 37.2% gain, led by standout performance from Citigroup (+65.8%), Goldman Sachs (+53.5%), and J.P. Morgan (+34.4%). By contrast, the KBW Regional Bank Total Return Index (KRX) rose just 6.5%, having spent much of the year in negative territory.
However, sentiment toward smaller banks is improving, and the group appears poised to regain some of the persistent valuation discount that has weighed on it in recent years. Negative headlines surrounding commercial real estate, interest rates, and private credit exposure have eased, and the late-year strength in smaller-cap bank stocks suggests a potential rotation may be underway.
Following a year in which record capital markets activity powered banner results for large banks, we believe “boring” is positioned to outperform in 2026. Smaller banks typically derive more than 80% of their revenue from spread-based businesses, and an easing cycle typically supports both NII and credit quality—providing relief to borrowers while enabling lenders to reprice liabilities lower.
We have already seen stabilization in previously stressed loan categories such as urban office. If these trends (favorable rates, supportive credit conditions, and a steady domestic economy) continue, smaller banks should be well positioned to rebound from multiyear valuation lows and narrow the performance gap with their larger peers.
Figure 1: Large Banks Back to Historical Average
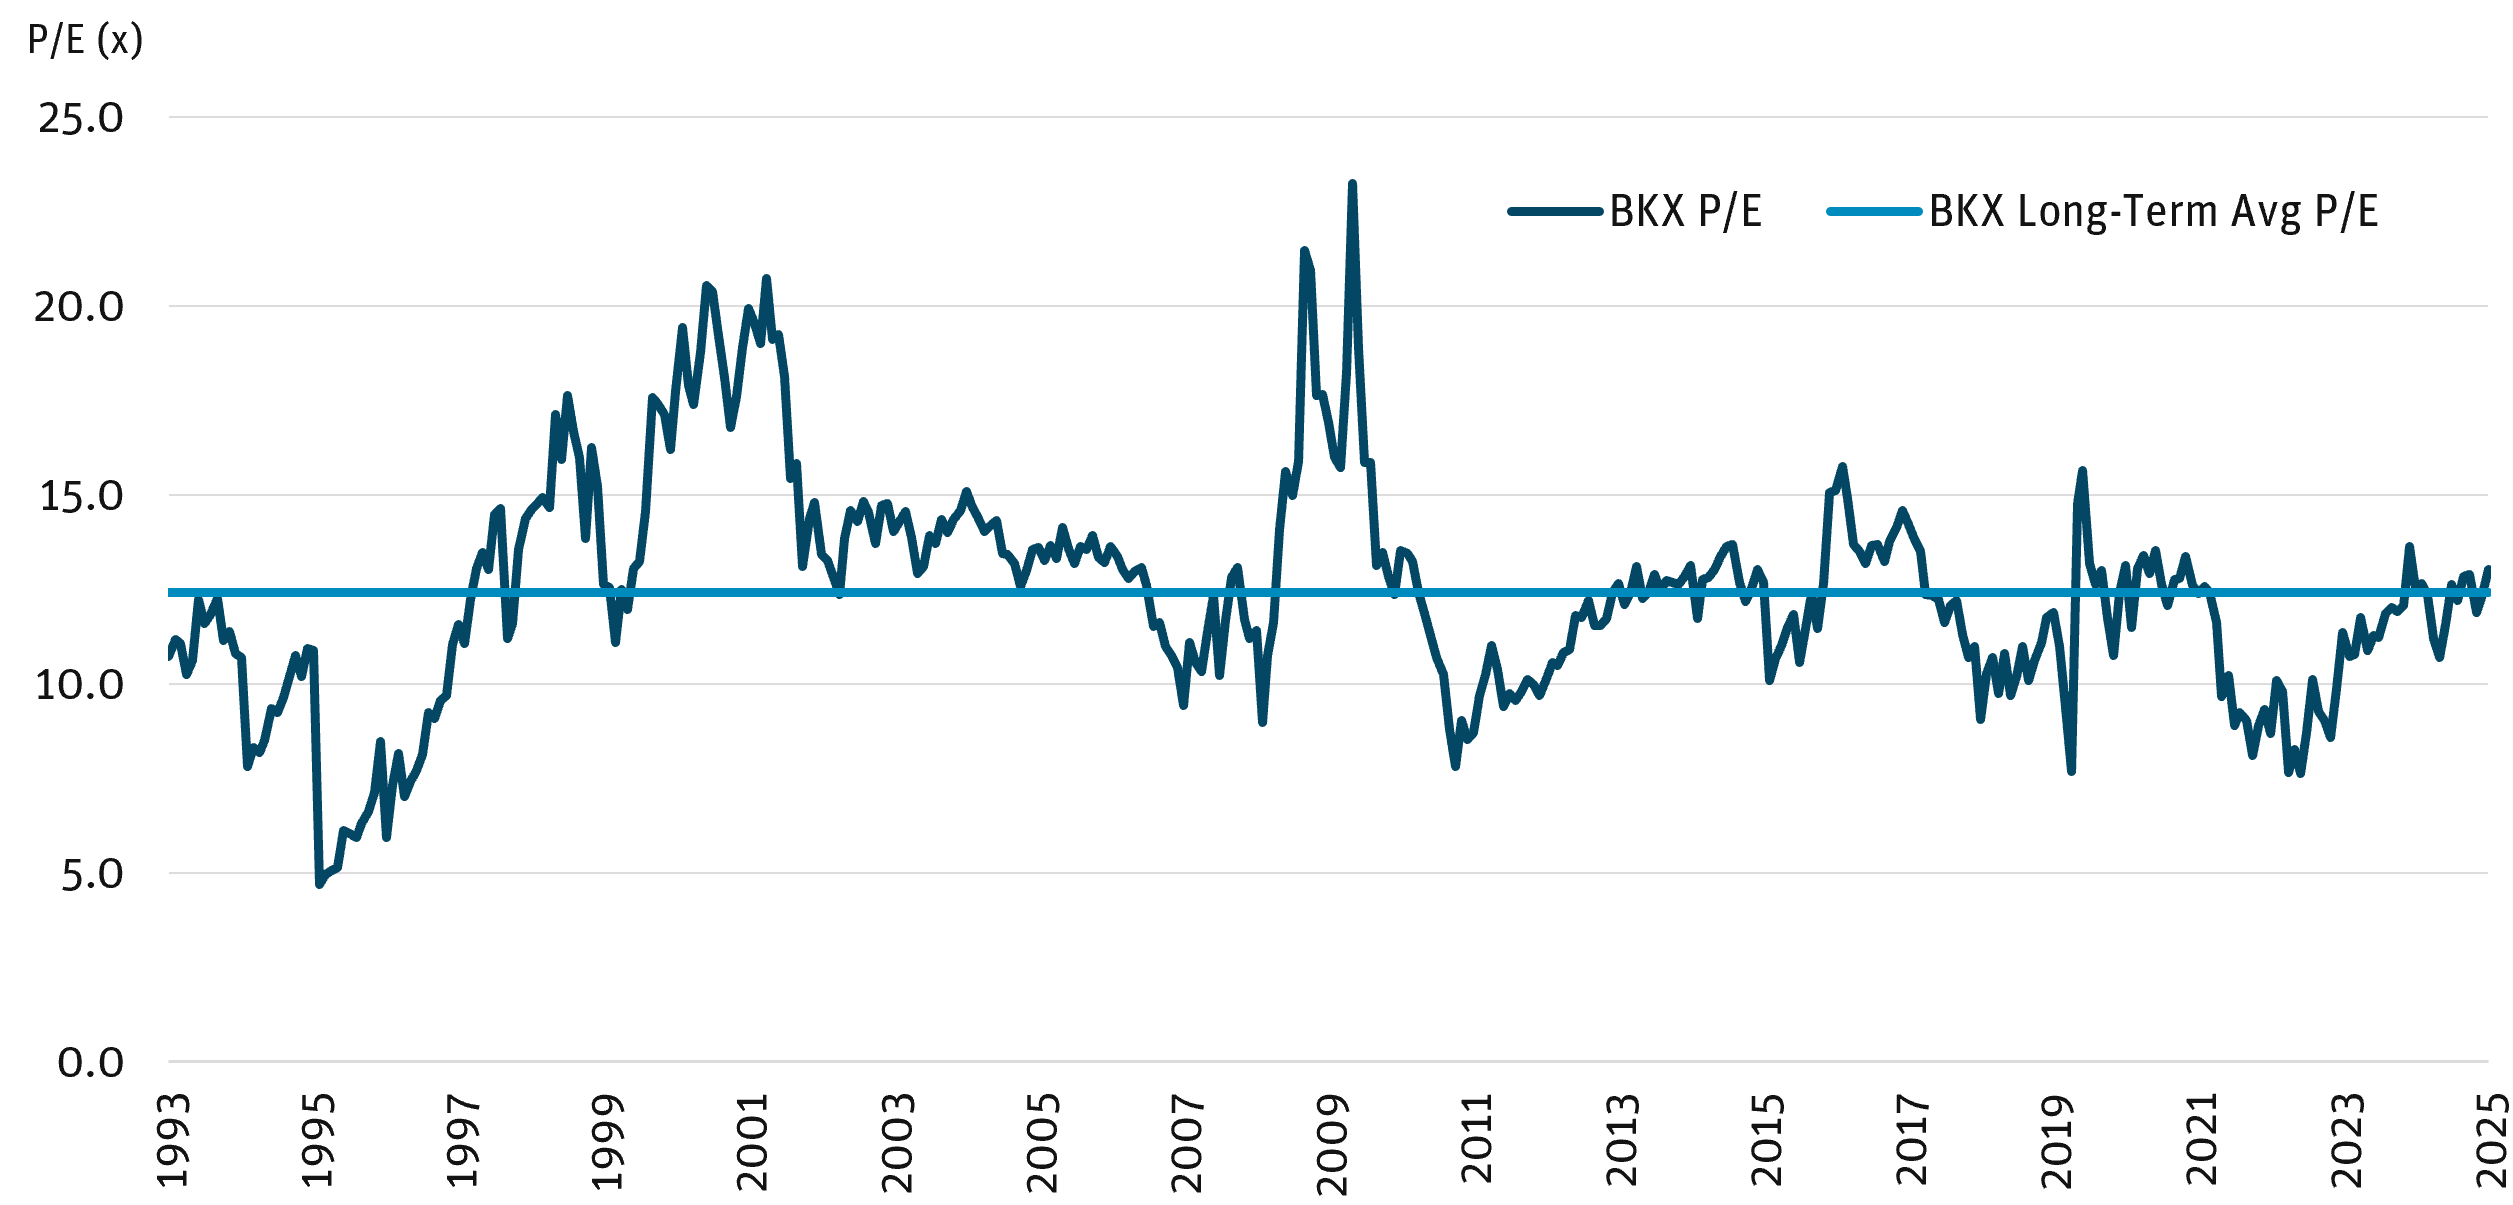
Source: KBW Research as of 12/31/25.
Figure 2: Opportunity for Mean Reversion for Smaller Banks
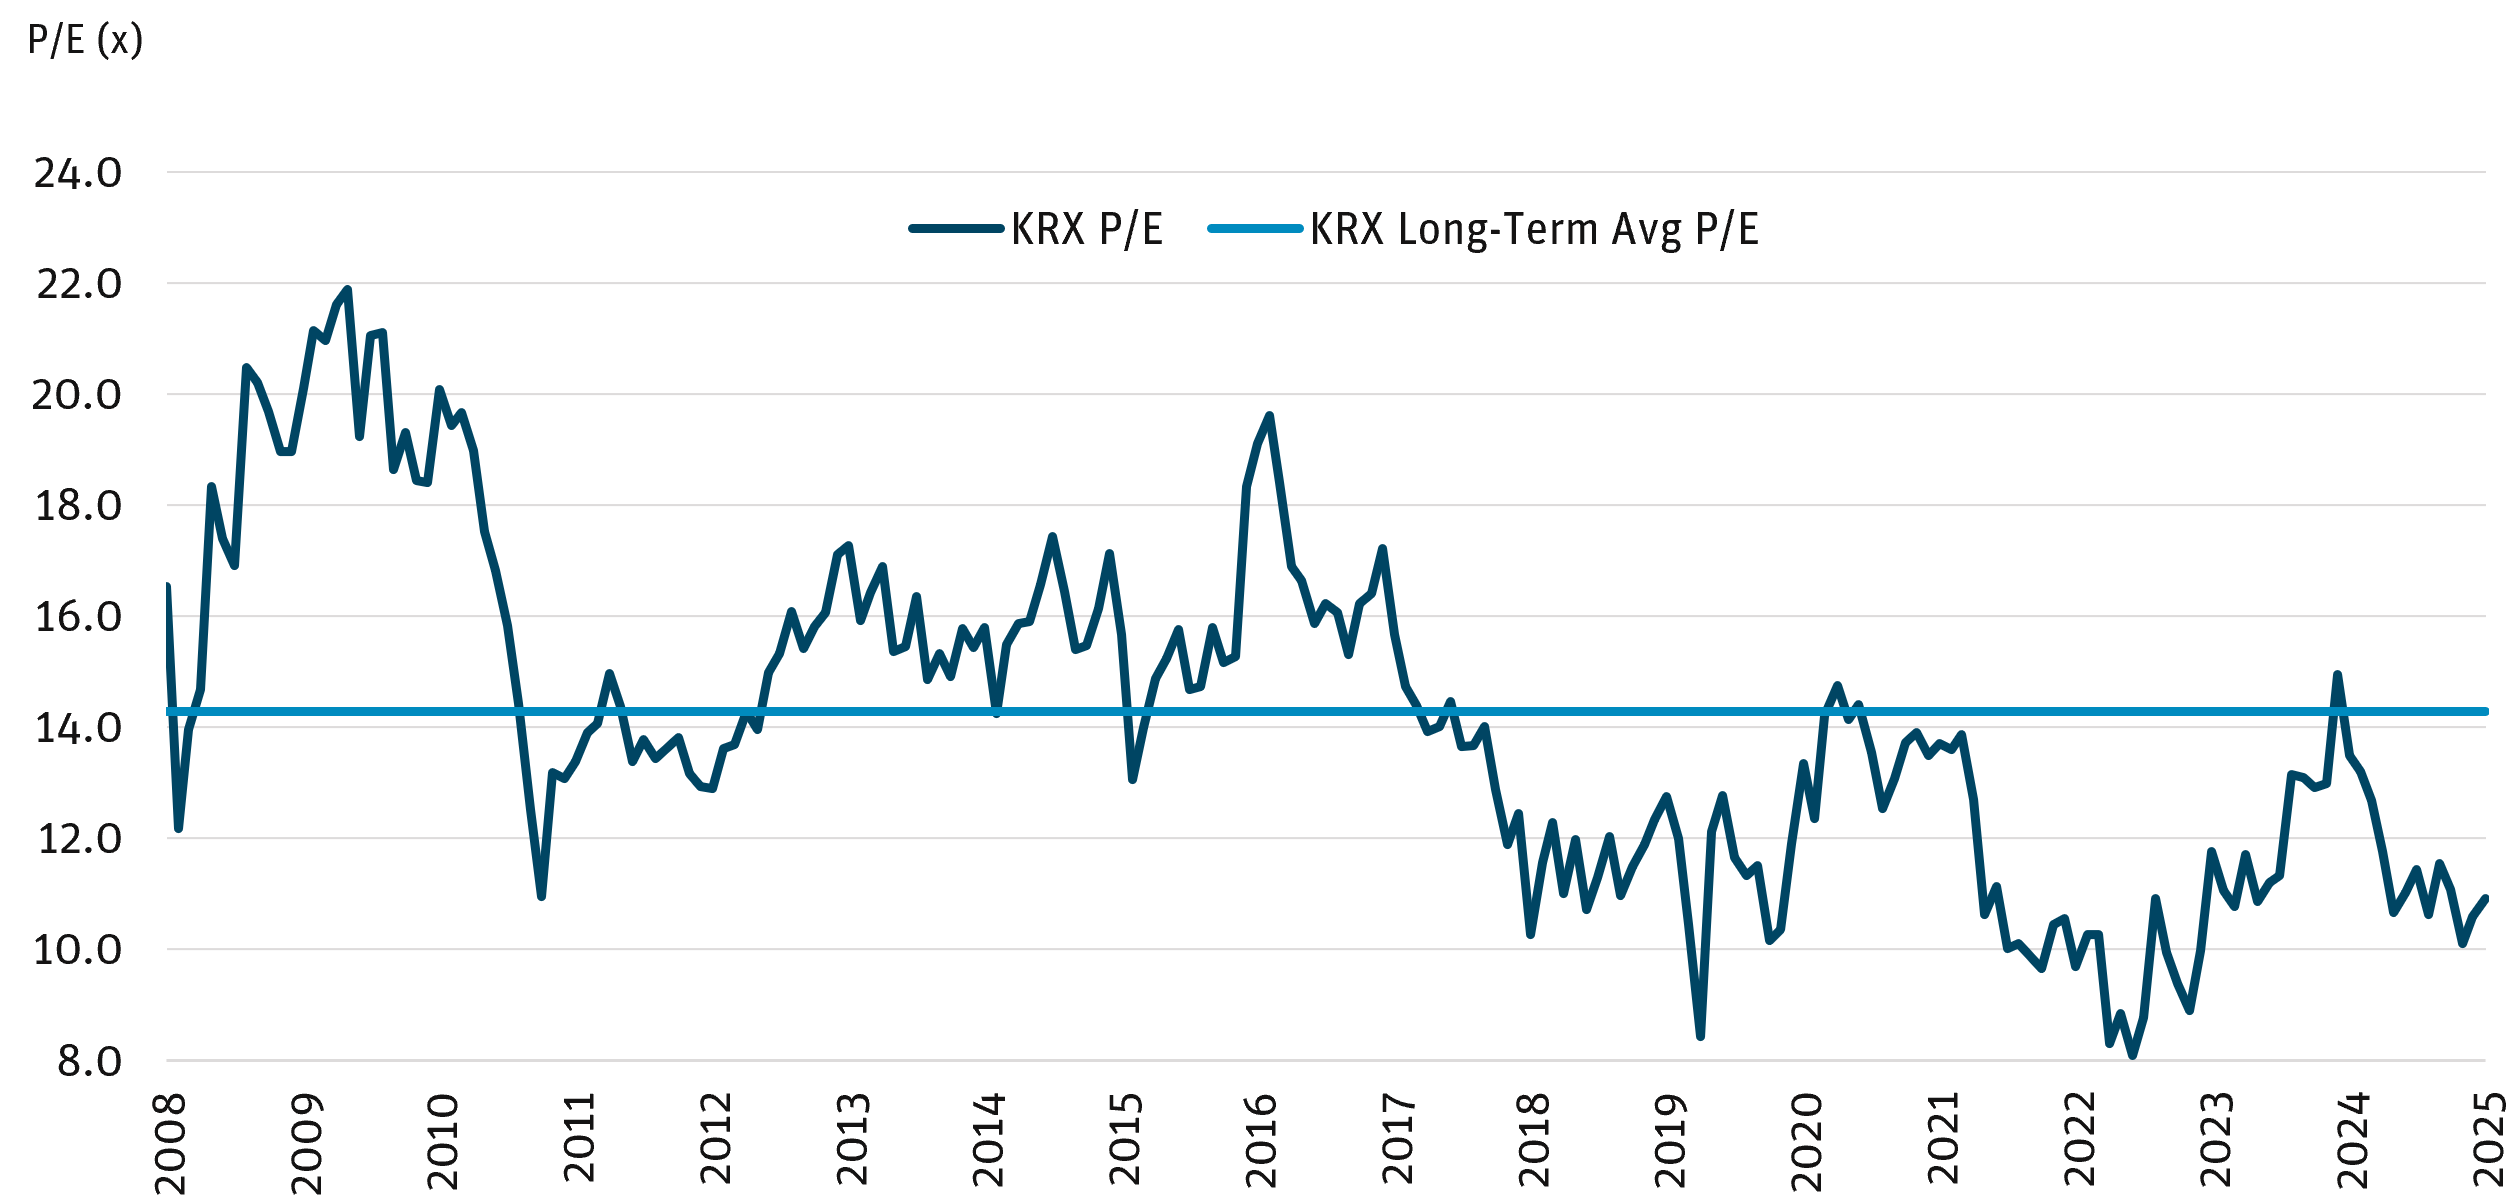
Source: KBW Research as of 12/31/25.
Bank debt performed strongly in 2025 as primary issuance rebounded sharply, supported by the 2020 peak-issuance vintage ($11 billion) entering its call period and an additional $3 billion maturing. With nearly $8 billion of new issuance, 2025 marked the third-strongest year on record for regional and community bank debt issuance.
We expect comparable issuance in 2026, supported by a robust refinancing pipeline and roughly $8 billion coming into its call period. Additionally, strong investor demand, a broadening investor base, and continued M&A acceleration should drive increased issuance over and above refinancings/maturities. While spreads have tightened, relative value remains attractive, and tighter spreads have benefited legacy bond pricing.
Figure 3: Steep Rebound in Bank Debt Primary Market Issuance

Source: Piper Sandler, KBW, Performance Trust as of 12/31/25.
Figure 4: Spreads Have Tightened on Increased Issuance
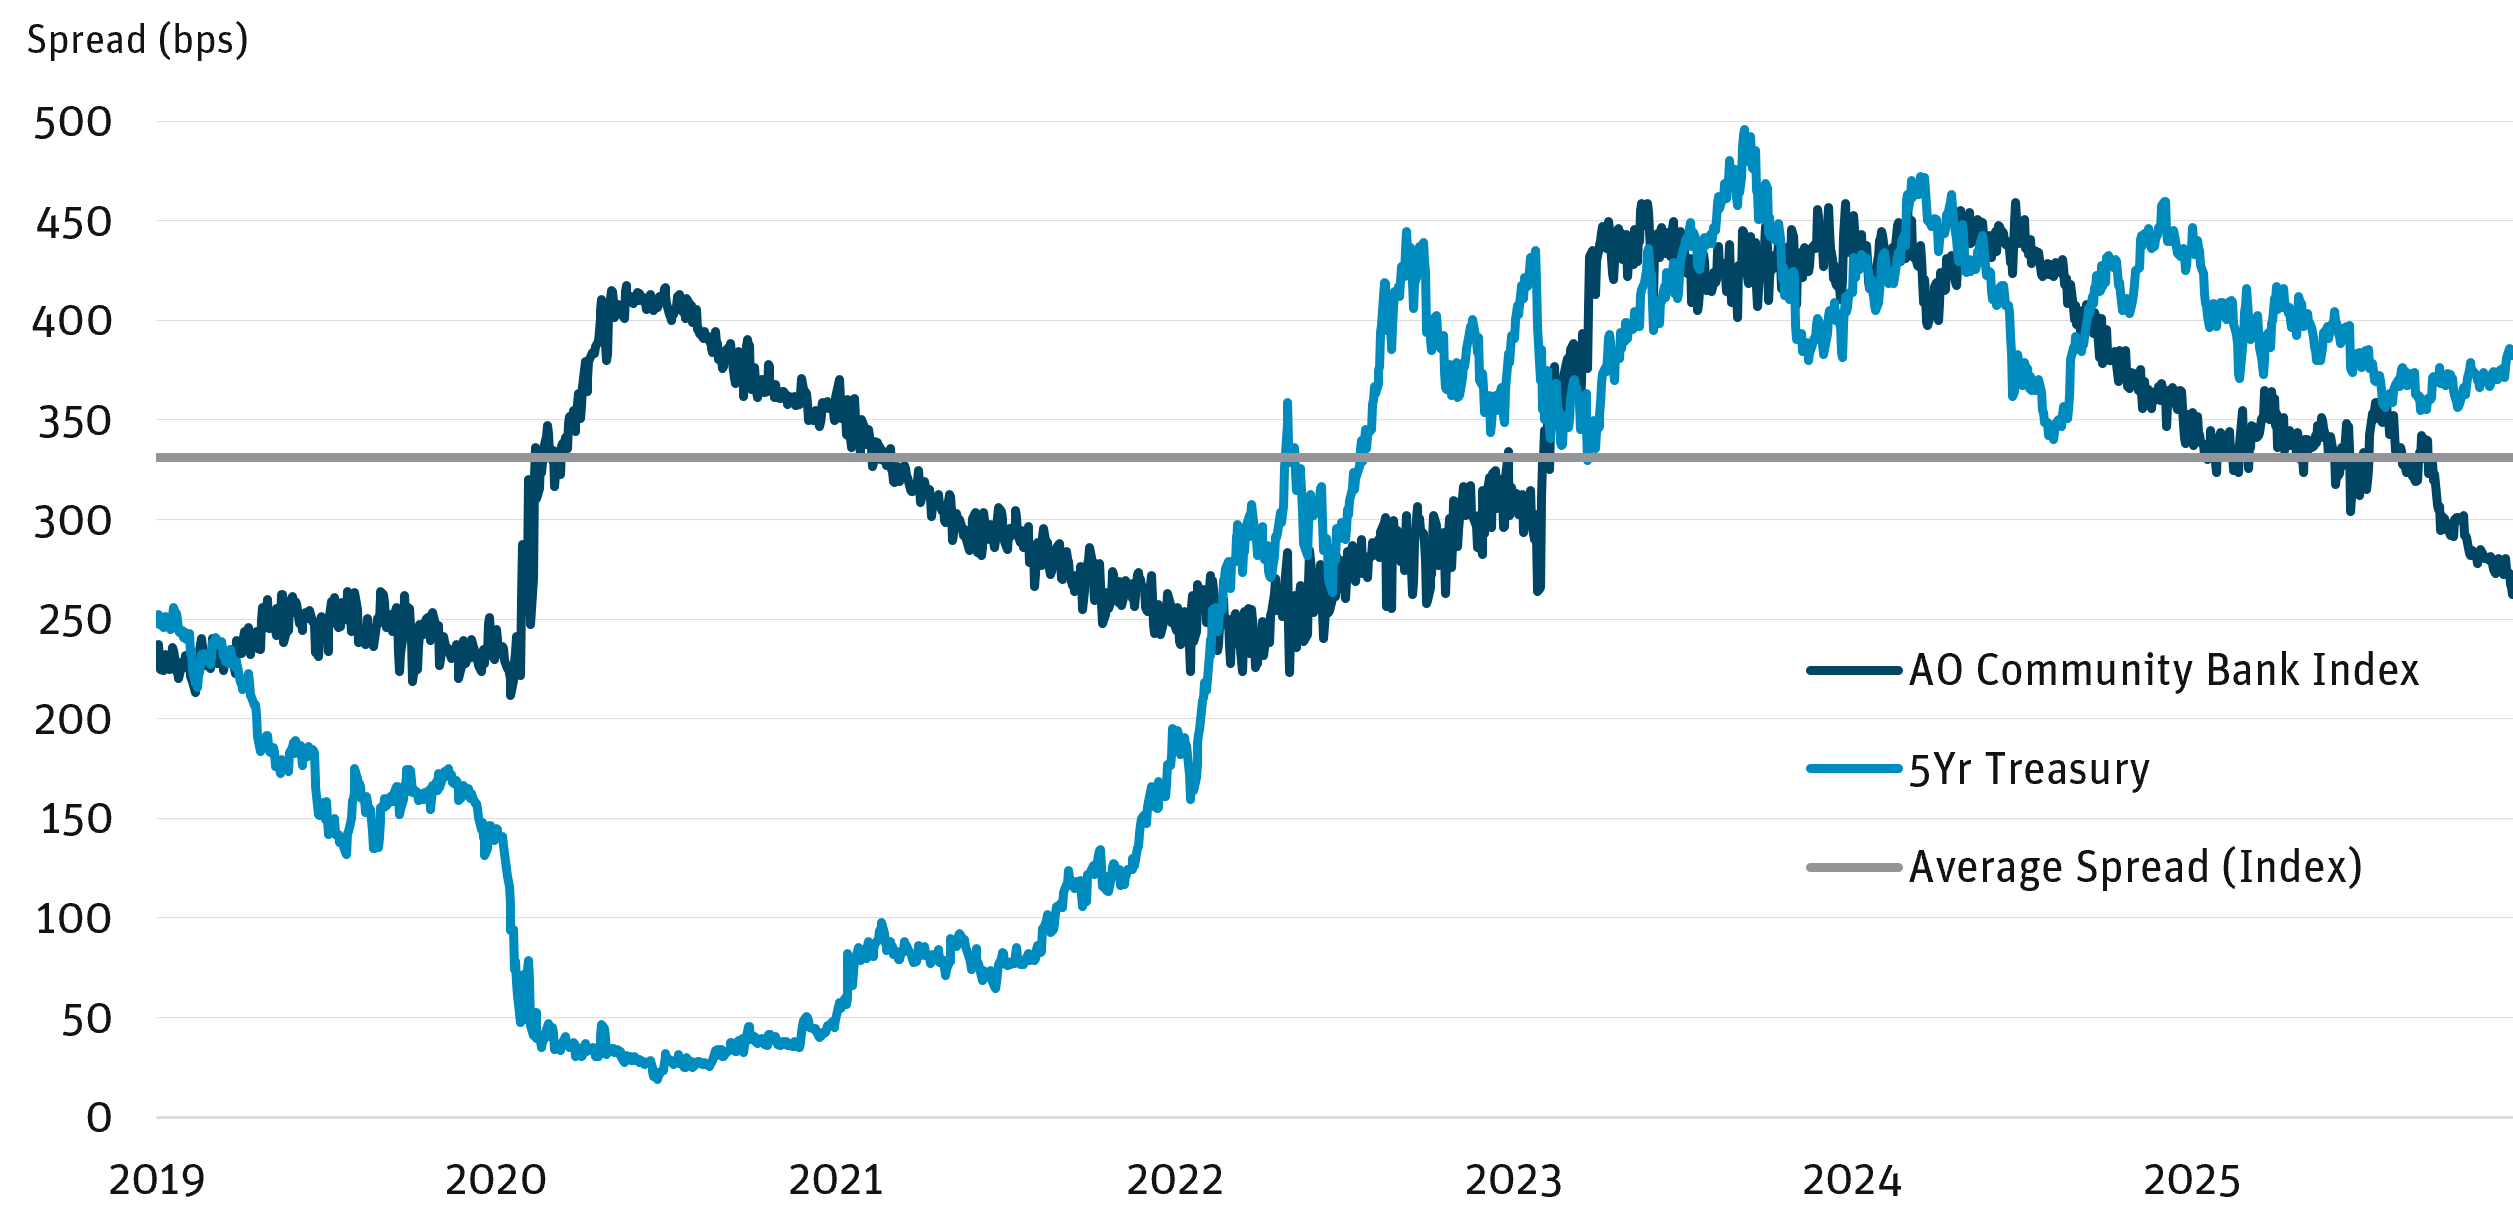
Source: Angel Oak Capital as of 12/31/25.
A TURNING POINT IN BANK REGULATION
After more than a decade of ever-tightening regulatory rules, though with a brief reprieve during the first Trump administration, we have entered a new era of bank regulation. The regulatory environment improved significantly in 2025, paving the way for an even better operating environment in 2026. The prior administration had taken a heavy-handed approach in several supervisory areas, particularly toward commercial real estate concentration, and imposed stringent constraints on bank M&A, slowing approvals and causing many deals to fail.
The current regulatory regime, by contrast, has adopted a softer, more deregulatory stance. Key actions include easing capital requirements, rolling back select consumer-protection rules such as the overdraft fee rule overturned by Congress, and proposing to raise the threshold for the strictest supervisory standards from $50 billion to $700 billion in assets. We expect further deregulatory progress in 2026, with a particular emphasis on unlocking excess capital.
The M&A environment has strengthened as well, with the consolidation run rate approaching pre-COVID levels. Not only is the pace of M&A increasing, but deal size is also trending higher as the regulatory appetite for larger deals has improved. The acceleration in M&A activity is evident in comparing fourth-quarter year-over-year deal activity:
- 4Q24: 32 deals totaling $5.3 billion
- 4Q25: 52 deals totaling $26.3 billion
Figure 5: Banking Sector Consolidation on the Rise
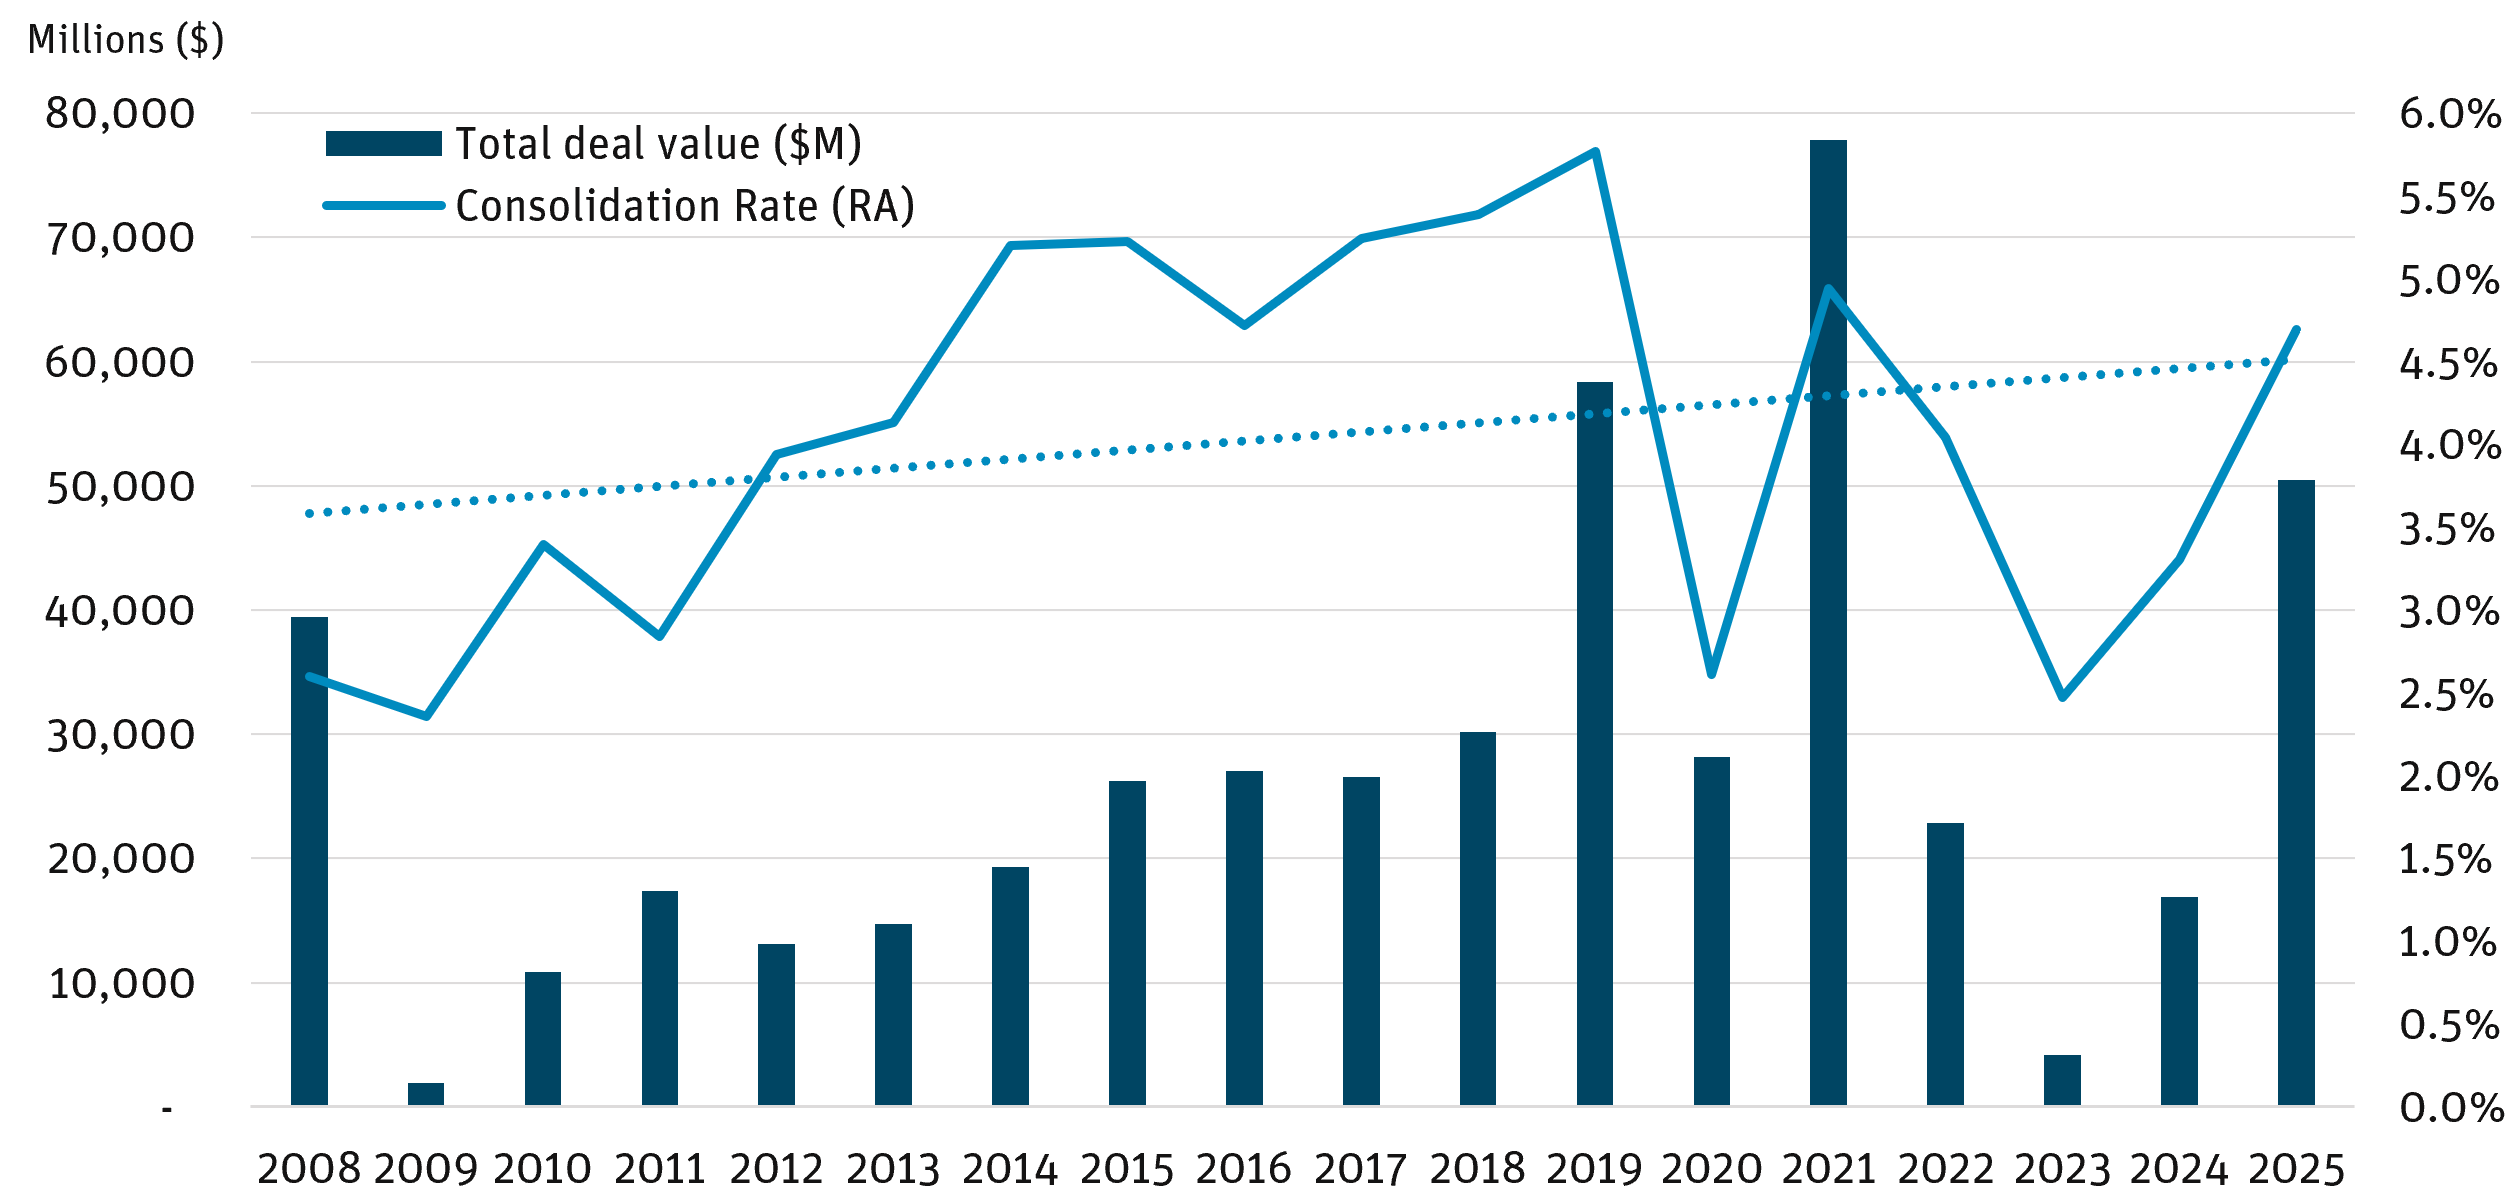
Source: Capital IQ Pro as of 12/31/25.
LOW RATES AND A STEEPER YIELD CURVE FUEL STRONG FUNDAMENTALS
2025 was one of the most profitable years on record for the banking system, as an easing Federal Reserve and a steepening yield curve, reversing nearly two years of inversion, drove a resurgence in capital markets activity as well as net interest margin (NIM) expansion. With 75 basis points of rate cuts in the books and expectations for the Fed to continue its easing campaign with at least two additional cuts in 2026, banks should continue benefiting from lower short-end rates and a steeper yield curve in 2026. Regional and community banks, which generate the bulk of their earnings from spread-based income, are poised to benefit the most.
Figure 6: Yield Curve Steepening After Nearly Two Years of Inversion
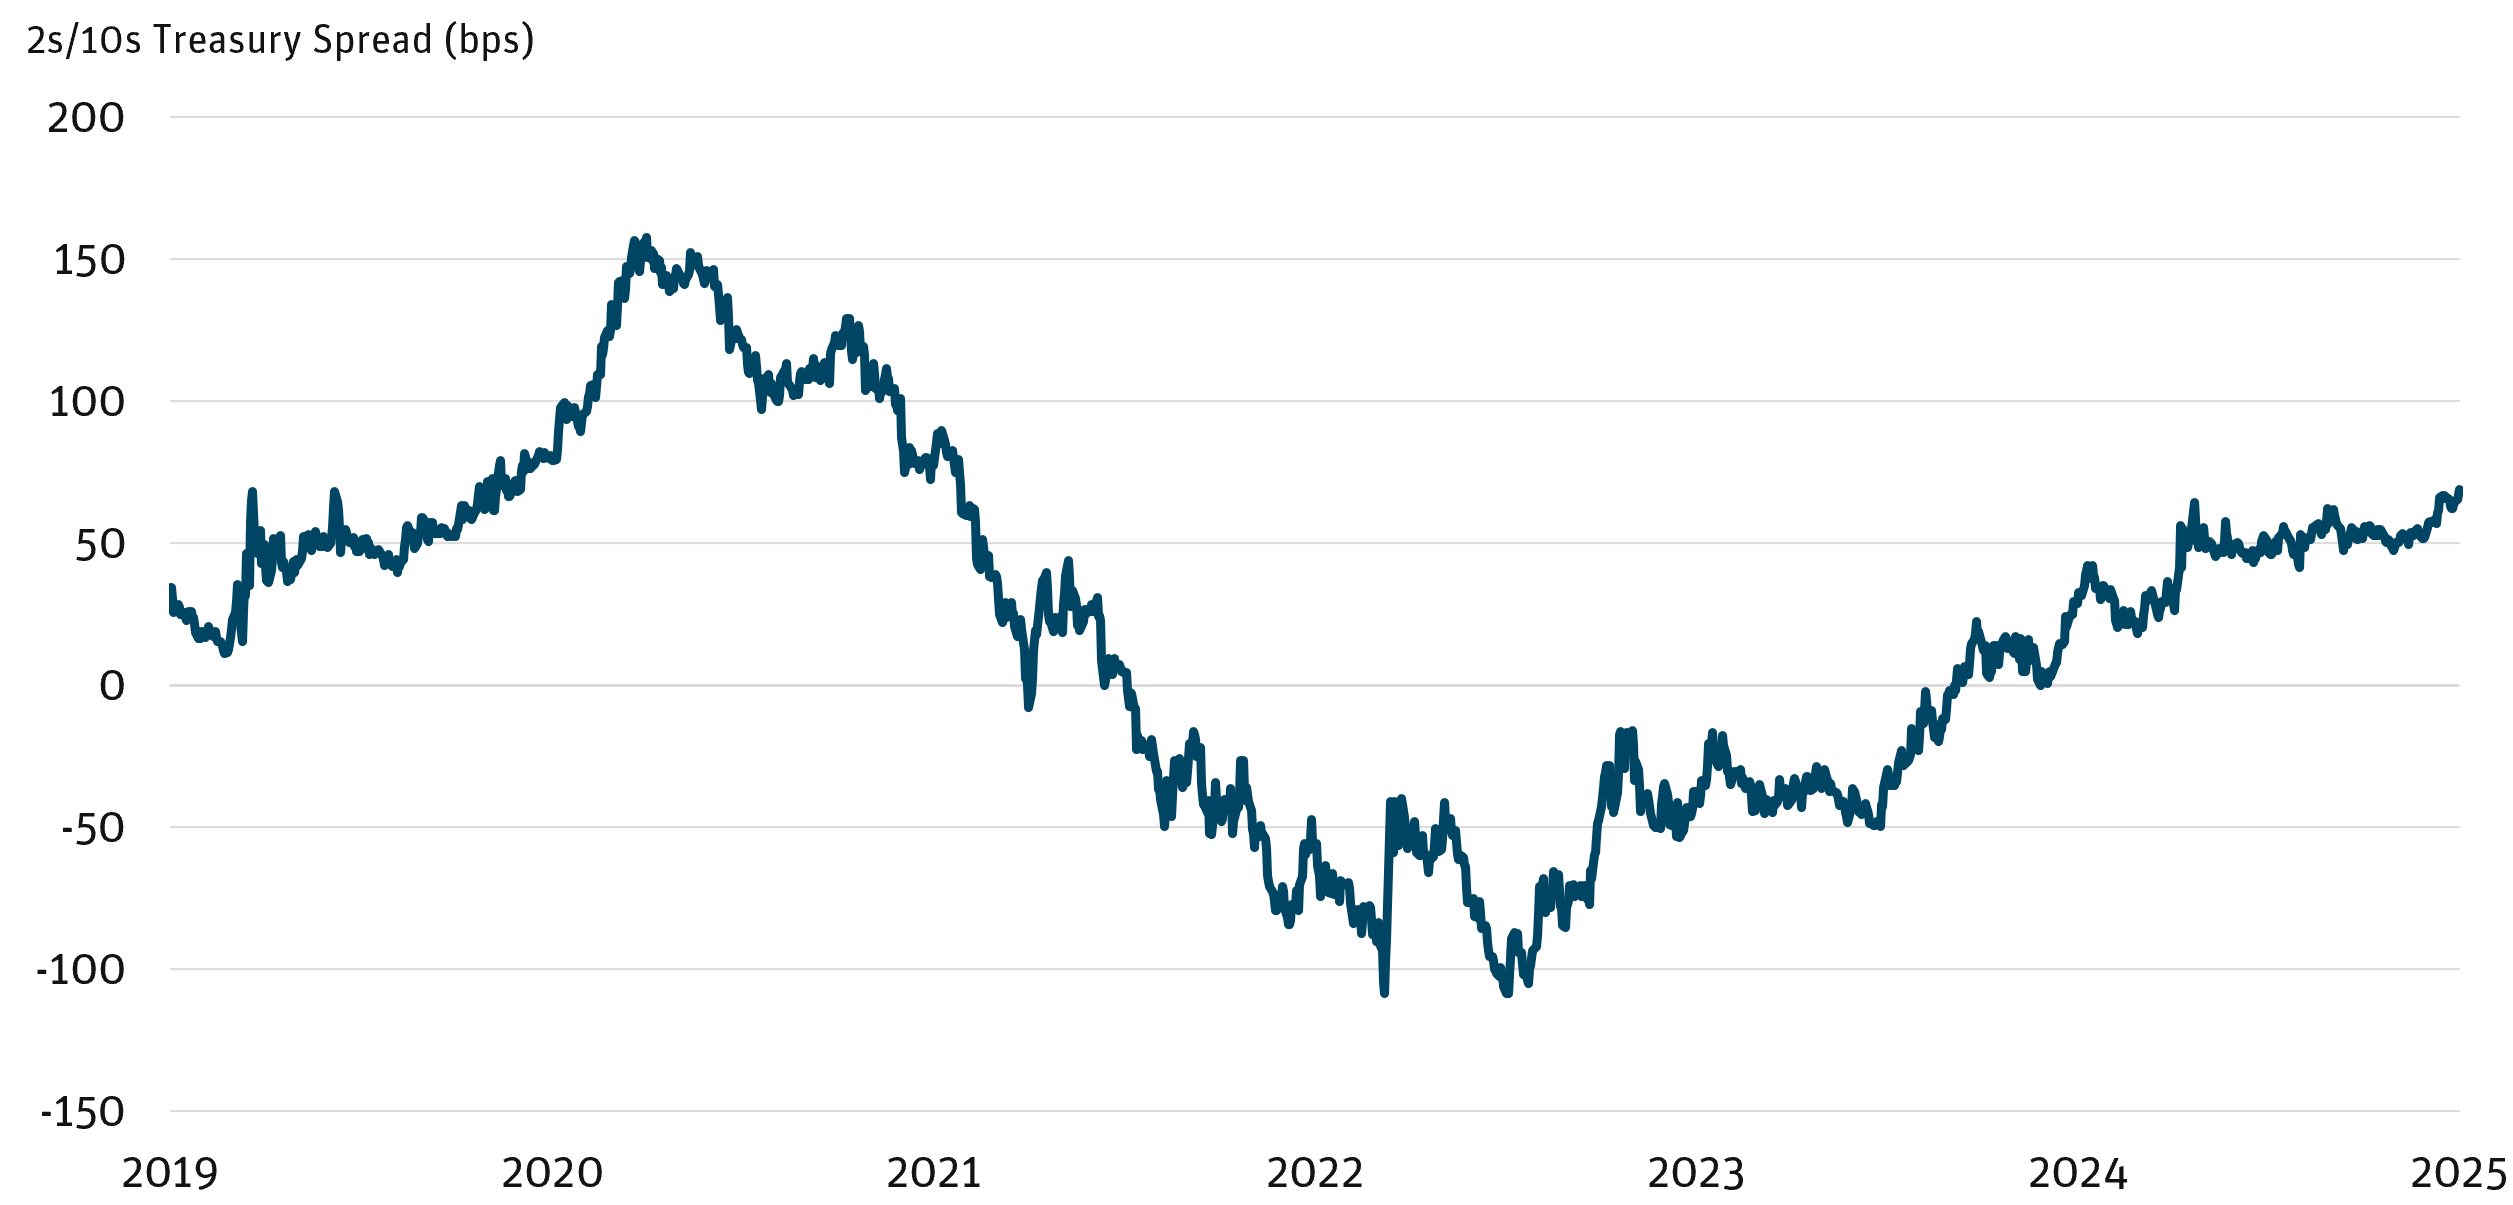
Source: Bloomberg as of 12/31/25.
Revenue Growth: Banks are well positioned for further NII growth as loan growth accelerates amid easing lending standards, lower rates, and increased M&A activity. Many fixed-rate assets are expected to reprice higher, as intermediate-term yields remain above the levels at which these assets were originally put on bank balance sheets (pre-hiking cycle). The anticipated end of quantitative tightening (QT), combined with continued rate cuts, should drive deposit growth and lower funding costs. Fee income should also benefit from ongoing momentum in capital markets, supported by resilient economic growth, a deregulatory environment, and robust trading activity.
Capital Return/Optimization: After more than a decade of ever-tightening regulatory rules, we are undergoing a sea change for banking regulation. With strong capital levels and profitability, a structural shift to a lighter touch regulatory environment should allow banks to better manage excess capital through increased share buybacks, dividends, and/or inorganic growth.
Credit-Positive Macro Backdrop: Credit quality remains strong. While credit costs will likely normalize from today’s low levels, we expect them to remain manageable, barring a recession. Leading indicators are improving, with criticized and non-performing loans continuing to decline. Lower rates are broadly credit-positive, improving borrower affordability and payment capacity. Commercial credit concerns, apart from a few idiosyncratic pockets, are easing across commercial real estate and private credit exposure, and lower consumer delinquencies will likely lead to lower defaults, outside some pockets of stress in lower income and lower-FICO segments.
Figure 7: NIM Expansion as Deposit Costs Decline
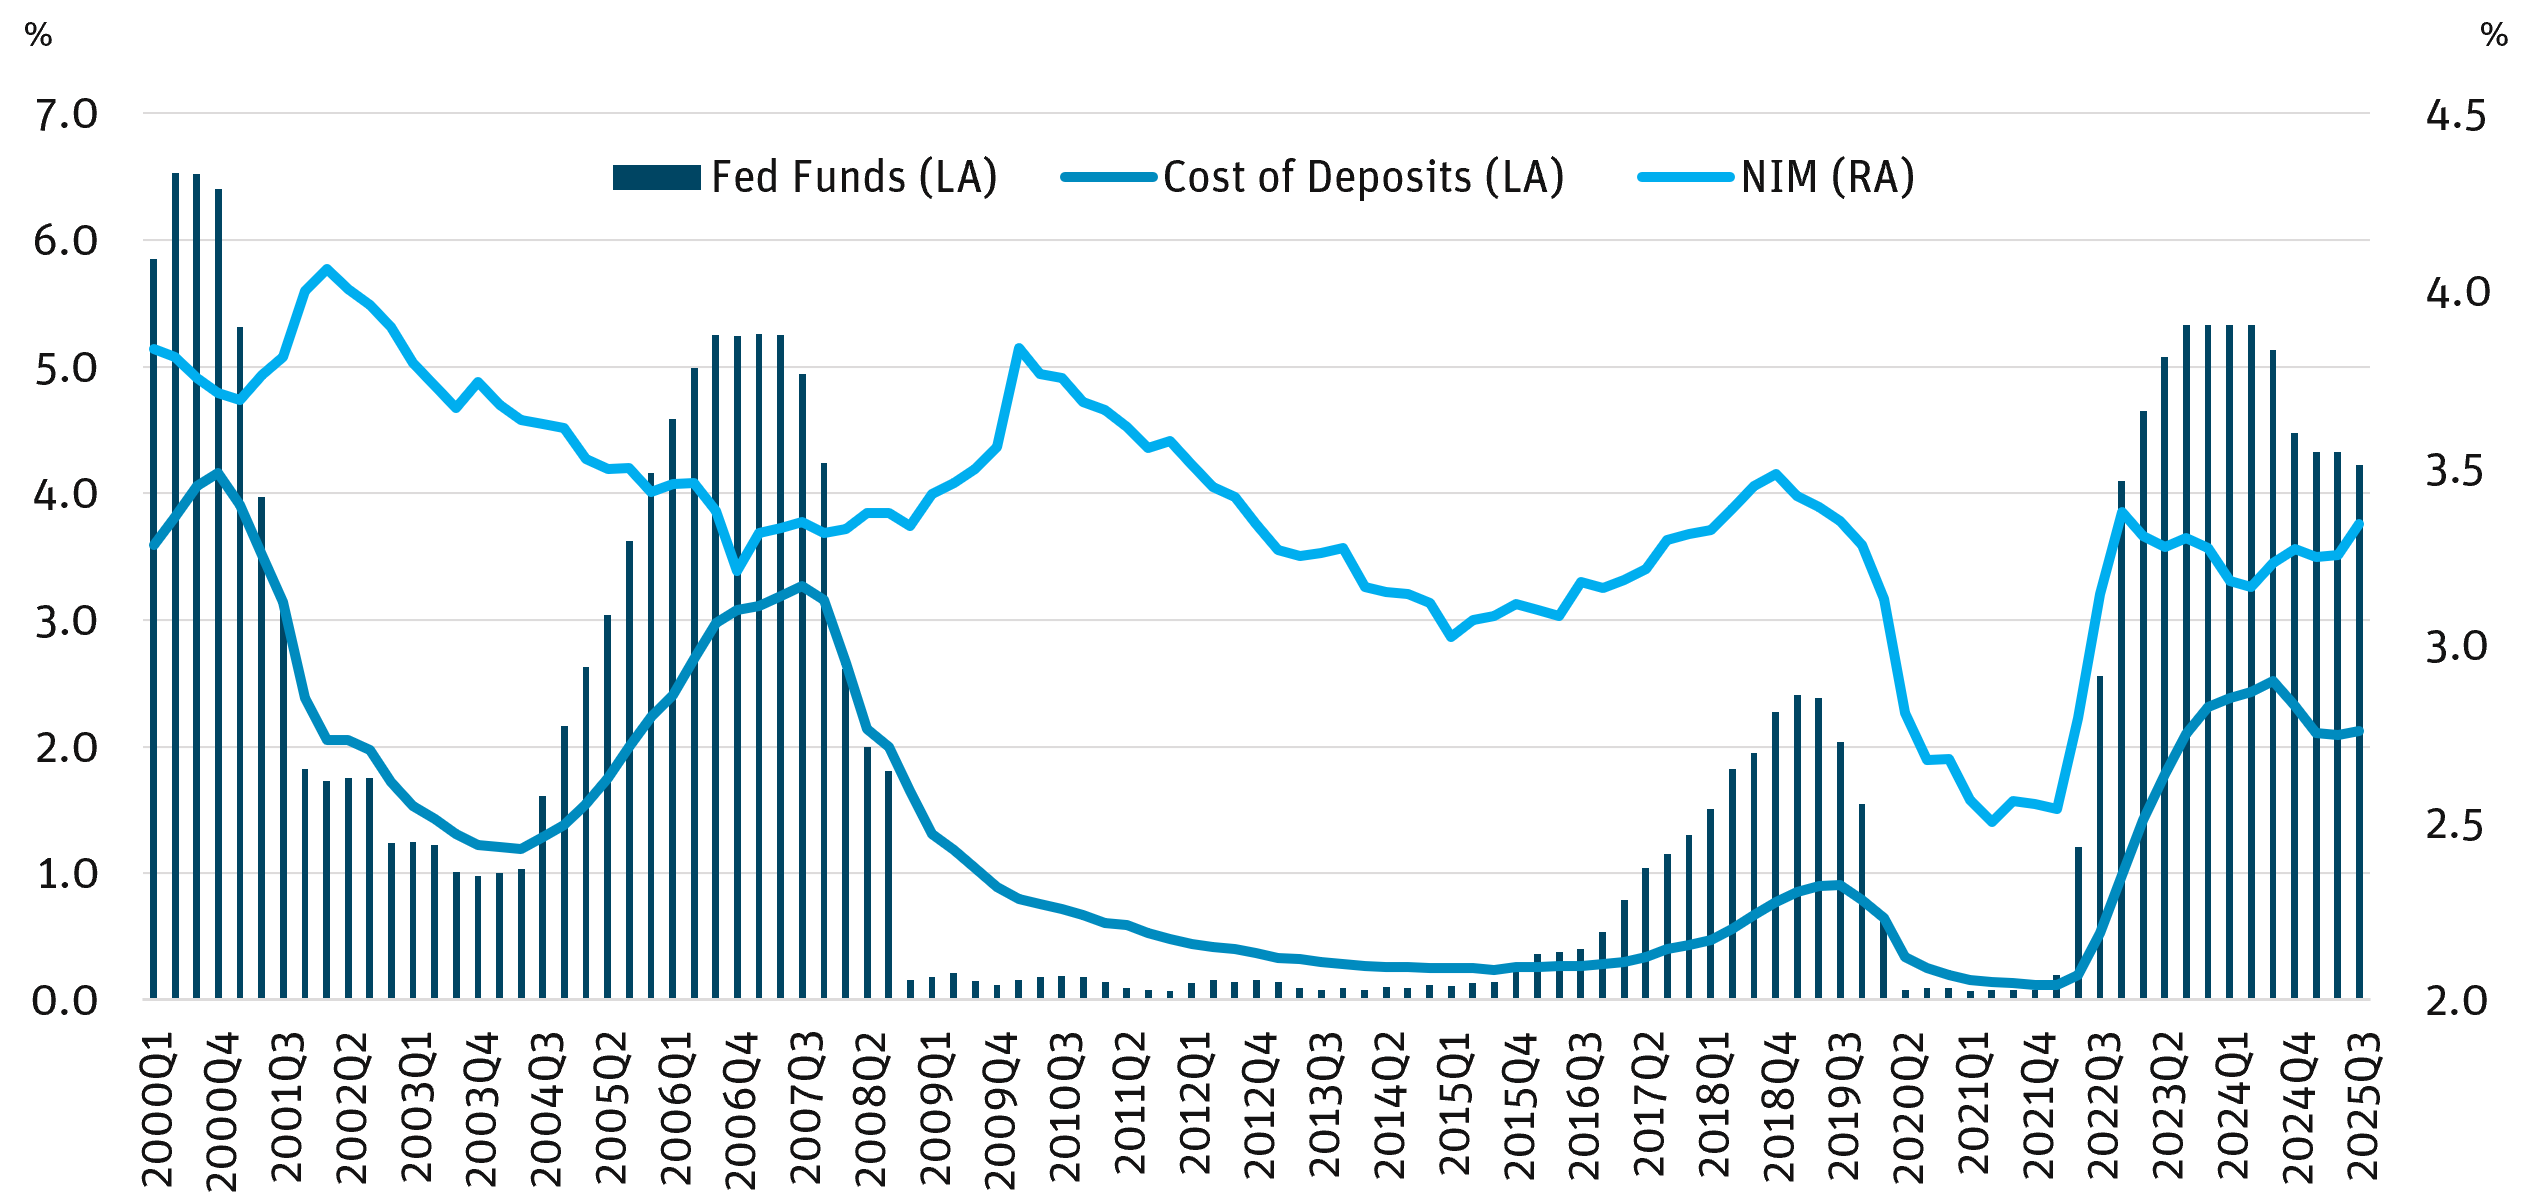
Source: FDIC, Federal Reserve as of 12/31/25.
Figure 8: Credit Losses Remain Low; Reserves Remain High
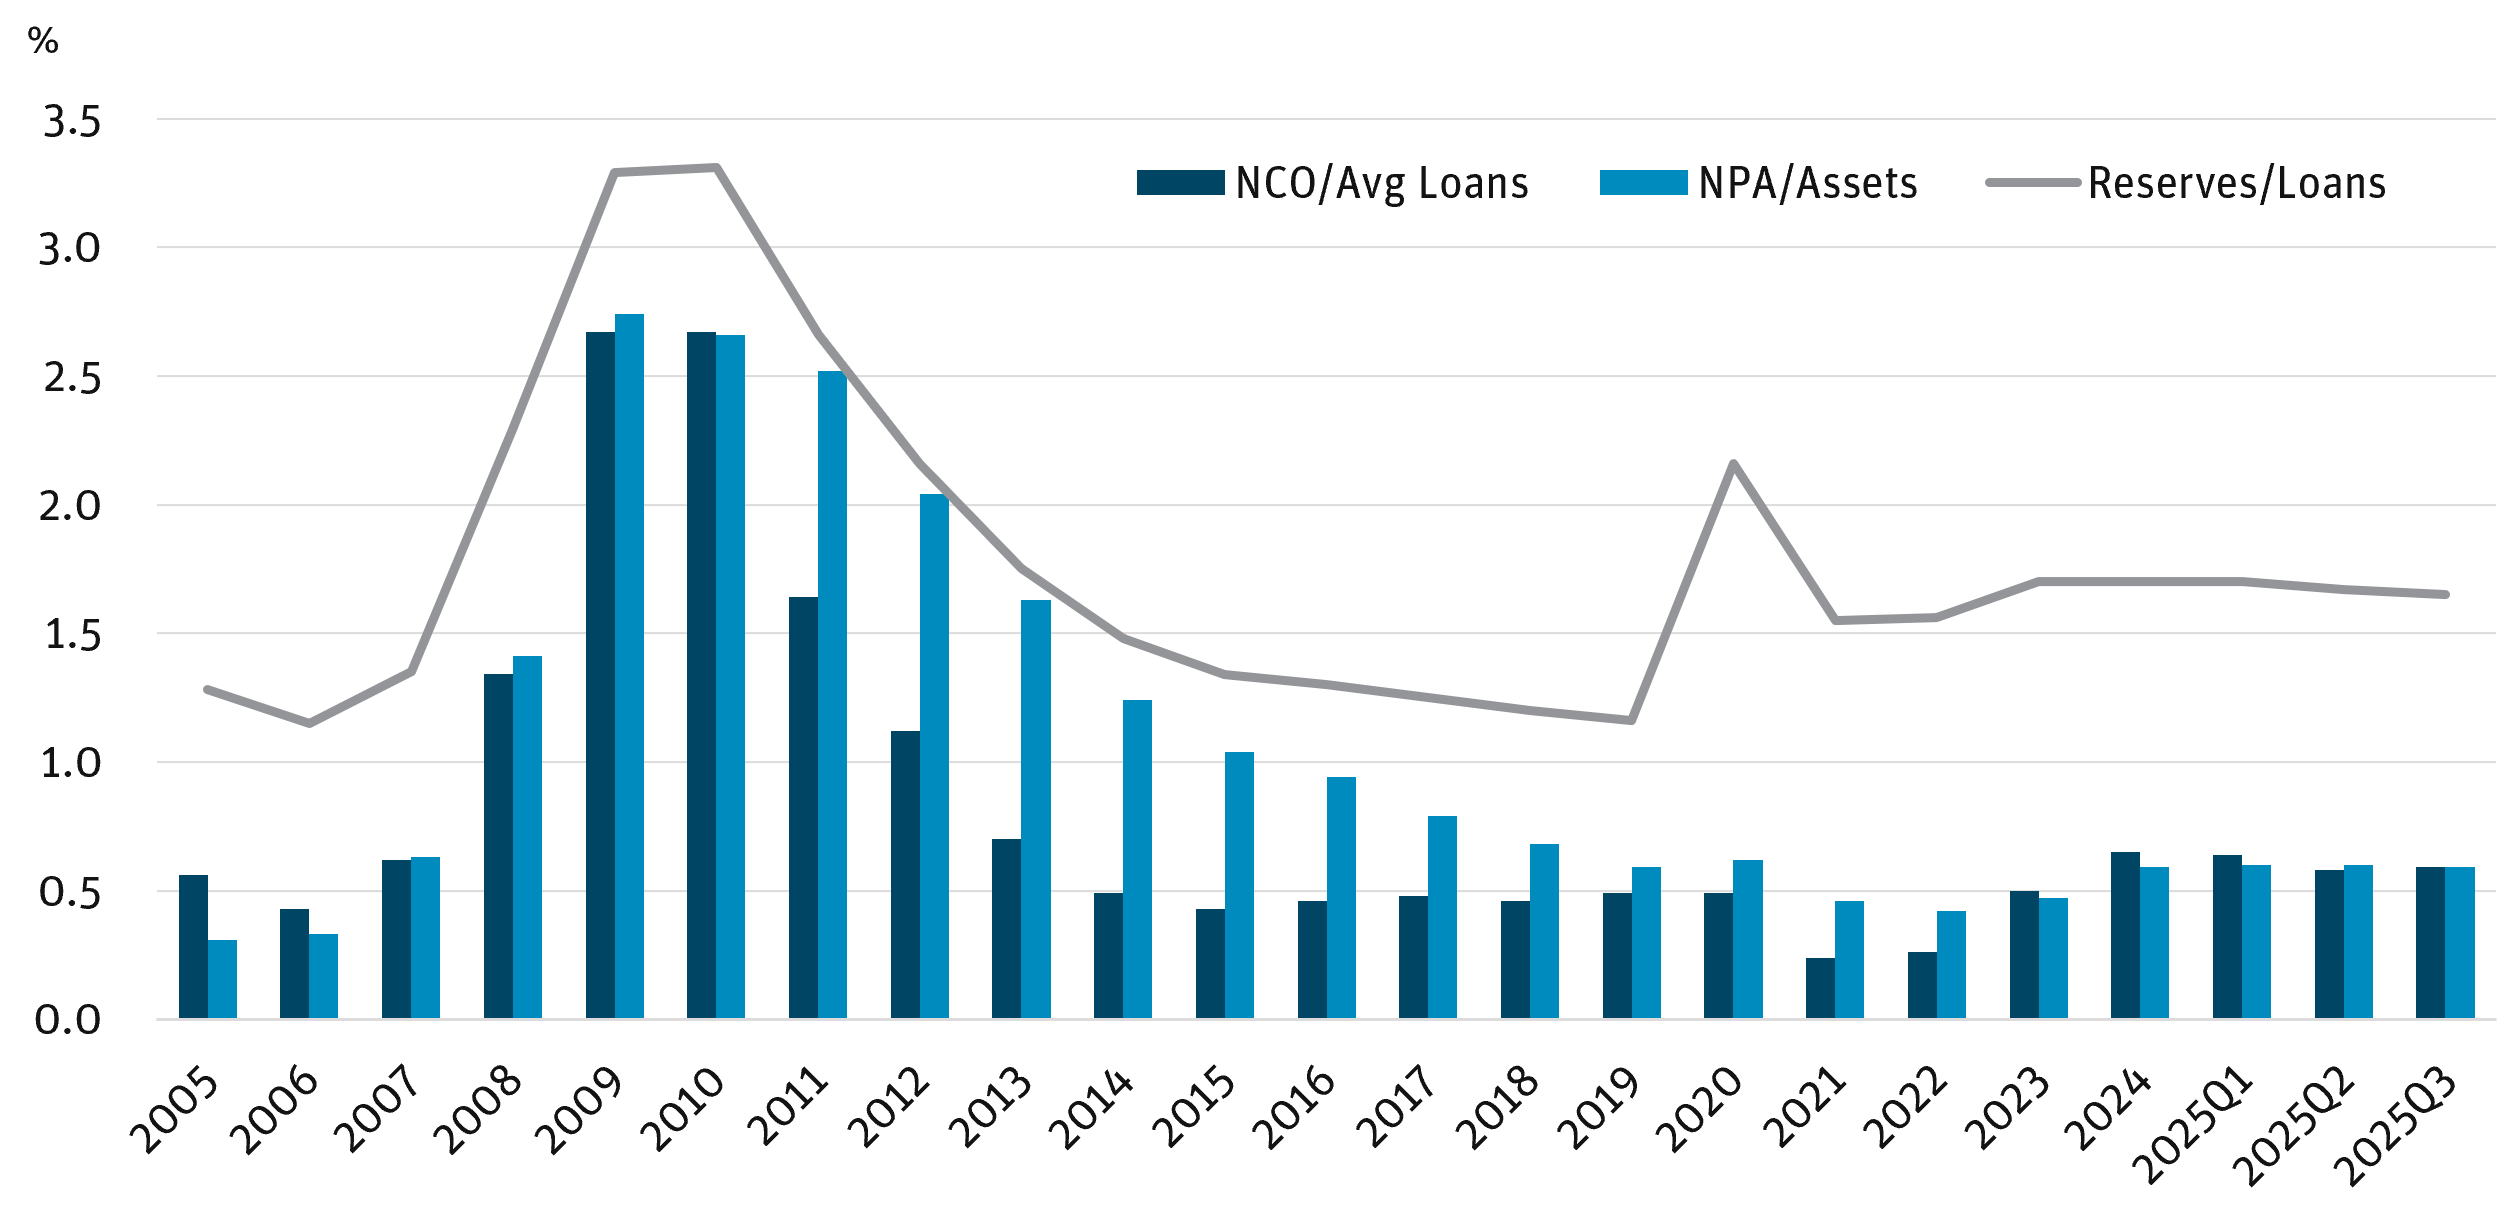
Source: S&P Capital IQ Pro as of 12/31/25.
INVESTMENT OPPORTUNITIES
The overhang from the 2023 regional bank mini-crisis continues to fade as the macro environment benefits from lower rates and a steeper curve, and we enter a new era of bank regulation. We expect 2026 to build on 2025’s strong outperformance. While the bigger banks were the early beneficiaries of the shifting rate and regulatory regime, particularly through the resurgence in capital markets activity, we believe 2026 is poised for outsized performance by the regional and community banks.
These institutions are positioned to realize the lagging benefits of lower rates across their predominantly spread-based business models, alongside the accelerating M&A wave. Regional and community banks continue to prudently manage both sides of their balance sheets, gathering core deposits and reducing excess liquidity—dual factors that boost both earnings and book value.
While capital return is often the most visible catalyst for equity performance, investors across the bank capital structure should benefit from the increased flexibility these institutions now have to buy back
stock, pay dividends, and refinance existing capital instruments. “Bigger” might have been better in recent years, but over the next 12–18 months, regional and community banks have a clear and manageable path to both absolute and relative outperformance.
DEFINITIONS AND DISCLOSURES
2s/10s Curve: The difference between the 10-year Treasury rate and the 2-year Treasury rate.
5-Year Treasury Index: A one-security index comprising the most recently issued 5-year U.S. Treasury note or
bond.
Accumulated Other Comprehensive Income (AOCI): Includes unrealized gains and losses that are reported in the equity section of the balance sheet.
Alpha: Measures the difference between a fund’s actual returns and its expected performance, given its level of risk (as measured by beta). A positive alpha figure indicates the fund has performed better than its beta would predict. In contrast, a negative alpha indicates a fund has underperformed, given the expectations established by the fund’s beta.
Angel Oak Community Bank Index: Tracks spreads on a homogeneous portion of the community bank sub-debt market.
Basis Point (bps): One hundredth of one percent and is used to denote the percentage change in a financial instrument.
Criticized Loan: A loan identified by regulators as having elevated credit risk due to weaknesses in the borrower’s repayment ability or collateral.
FICO: Fair Isaac Corporation.
KBW Bank Index (BKX): The index is designed to track the performance of the leading banks and thrifts that are publicly-traded in the U.S.
KBW Regional Banking Index (KRX): The index seeks to reflect the performance of U.S. companies that do business as regional banks or thrifts.
M&A: Mergers and acquisitions.
NCO: Net charge-off.
Net Interest Income (NII): The difference between the revenue generated from a bank’s interest-bearing assets and expenses incurred while paying its interest-bearing liabilities.
Net Interest Margin (NIM): An industry-specific profitability ratio for banks and other financial institutions. It is a measure of the spread a bank earns between interest income and the amount of interest paid out to its depositors, expressed as a percentage of earning assets.
Nonperforming Loan (NPL): A loan in which the borrower is in default and has not made any scheduled payments of principal or interest for a certain period of time.
NPA: Non-performing asset.
Price/Earnings (P/E) Ratio: The ratio of a company’s stock price to the company’s earnings per share.
Quantitative Tightening (QT): Also known as balance sheet normalization, it refers to monetary policies that contract or reduce a central bank’s balance sheet.
Spread: The difference in yield between a U.S. Treasury bond and a debt security with the same maturity but of lesser quality.
Yield Curve: The U.S. Treasury yield curve refers to a line chart that depicts the yields of short-term Treasury bills compared to the yields of long-term Treasury notes and bonds. The slope, shape, and level of yield curves may vary over time with changes in interest rates.
It is not possible to invest directly in an index.
Must be preceded or accompanied by a prospectus. To obtain an electronic copy of the prospectus, please visit www.angeloakcapital.com.
Opinions expressed are as of 12/31/25 and are subject to change at any time, are not guaranteed, and should not be considered investment advice.
Investing involves risk; principal loss is possible. Investments in debt securities typically decrease when interest rates rise. This risk is usually greater for longer-term debt securities. Investments in lower-rated and non-rated securities present a greater risk of loss to principal and interest than do higher-rated securities. Investments in asset-backed and mortgage-backed securities include additional risks that investors should be aware of, including credit risk, prepayment risk, possible illiquidity and default, as well as increased susceptibility to adverse economic developments. Derivatives involve risks different from—and in certain cases, greater than—the risks presented by more traditional investments. Derivatives may involve certain costs and risks such as illiquidity, interest rate, market, credit, management and the risk that a position could not be closed when most advantageous. Investing in derivatives could lead to losses that are greater than the amount invested. The Fund may make short sales of securities, which involves the risk that losses may exceed the original amount invested. The Fund may use leverage, which may exaggerate the effect of any increase or decrease in the value of securities in the Fund’s portfolio or the Fund’s net asset value, and therefore may increase the volatility of the Fund. Investments in foreign securities involve greater volatility and political, economic and currency risks and differences in accounting methods. These risks are increased for emerging markets. Investments in fixed-income instruments typically decrease in value when interest rates rise. The Fund will incur higher and duplicative costs when it invests in mutual funds, ETFs and other investment companies. There is also the risk that the Fund may suffer losses due to the investment practices of the underlying funds. For more information on these risks and other risks of the Fund, please see the Prospectus.
Past performance does not guarantee future results. Index performance is not indicative of Fund performance. Current Fund performance can be obtained by calling 855-751-4324.
A full list of fund holdings can be found at www.angeloakcapital.com/resources and are subject to risk and to change at any time. Any discussion of individual companies is not intended as a recommendation to buy, hold, or sell securities issued by those companies.
The Angel Oak Funds are distributed by Quasar Distributors, LLC.
© 2026 Angel Oak Capital Advisors, which is the adviser to the Angel Oak Funds.