In this white paper, we examine the overall relative value case for Non-QM as compared with Agency or conventional mortgages. We take a closer look at the convexity profile for Non-QM, along with comparing the credit characteristics relative to Agency mortgages. With relative value a consistent topic in our conversations with clients, we hope this analysis sheds some light on our views, especially in the context of the volatile market environment. As always, we welcome your feedback, and please reach out if you have any questions.
Potential Convexity Advantage in Non-QM
When evaluating relative value in Non-QM, one advantage over Agency loans is the better convexity, or a flatter S-curve profile. The S-curve is the prepayment response function for borrowers at different rate levels or incentives. Looking at the S-curve based on the past 2 years of observations in the chart below, Agency loans, for example, prepaid in the mid-30s CPR (annualized prepayment rate) at 100 bps of rate incentive, whereas Non-QM speeds have hovered around a high-teens CPR. On the other hand, deep out-of-the-money prepayment speeds in Non-QM tend to be slightly faster than in Agency, as shown in the chart below when the X-axis dips below zero.
There are several reasons for this, in our opinion:
-
- With alternative documentation underwriting, Non-QM loans have more limited refinancing channels compared with Agency loans, thus reducing the ability to refi at the margin.
-
- Underwriting cost/time/complexity: Non-QM underwriting is still a manual and costlier process, whereas automated underwriting systems for Agency loans are well established.
-
- For investment property collateral within Non-QM, debt service coverage ratio (DSCR) loans come with prepayment penalties, thus significantly reducing the refi incentive in the loan’s first few years.
-
- In the recent environment, Non-QM rates have come much closer to Agency rates. The spread between Non-QM and Agency has shrunk to inside of 100 bps compared with 150-200 bps historically. This has led to slower prepayments in Non-QM loans – down to mid- to high-teens CPR compared with mid-20s CPR historically.
-
- Non-QM Bank Statement loans typically cater to self-employed individuals and small-business owners. For those borrowers who are looking to expand their businesses, tapping into their home equity even at higher rates could be a compelling option. We saw this play out in the 2022-2023 sell-off environment, when cash-out refinancing volume was consistent while rate refinancing volume vanished.
Looking at historical data, this relative convexity advantage still held in very fast prepaying environments. During the refi boom back in 2021, conventional Agency mortgages prepaid at 50%-60% CPR on average, even at slightly in-the-money rate incentives. By contrast, Non-QM Bank Statement prepayment speeds generally stayed in the high-30s to low-40s CPR range, while Investor Cash Flow (ICF) loans ramped only to mid-30s CPR.
Non-QM vs. Conventional S-Curve (13-24 Month WALA)
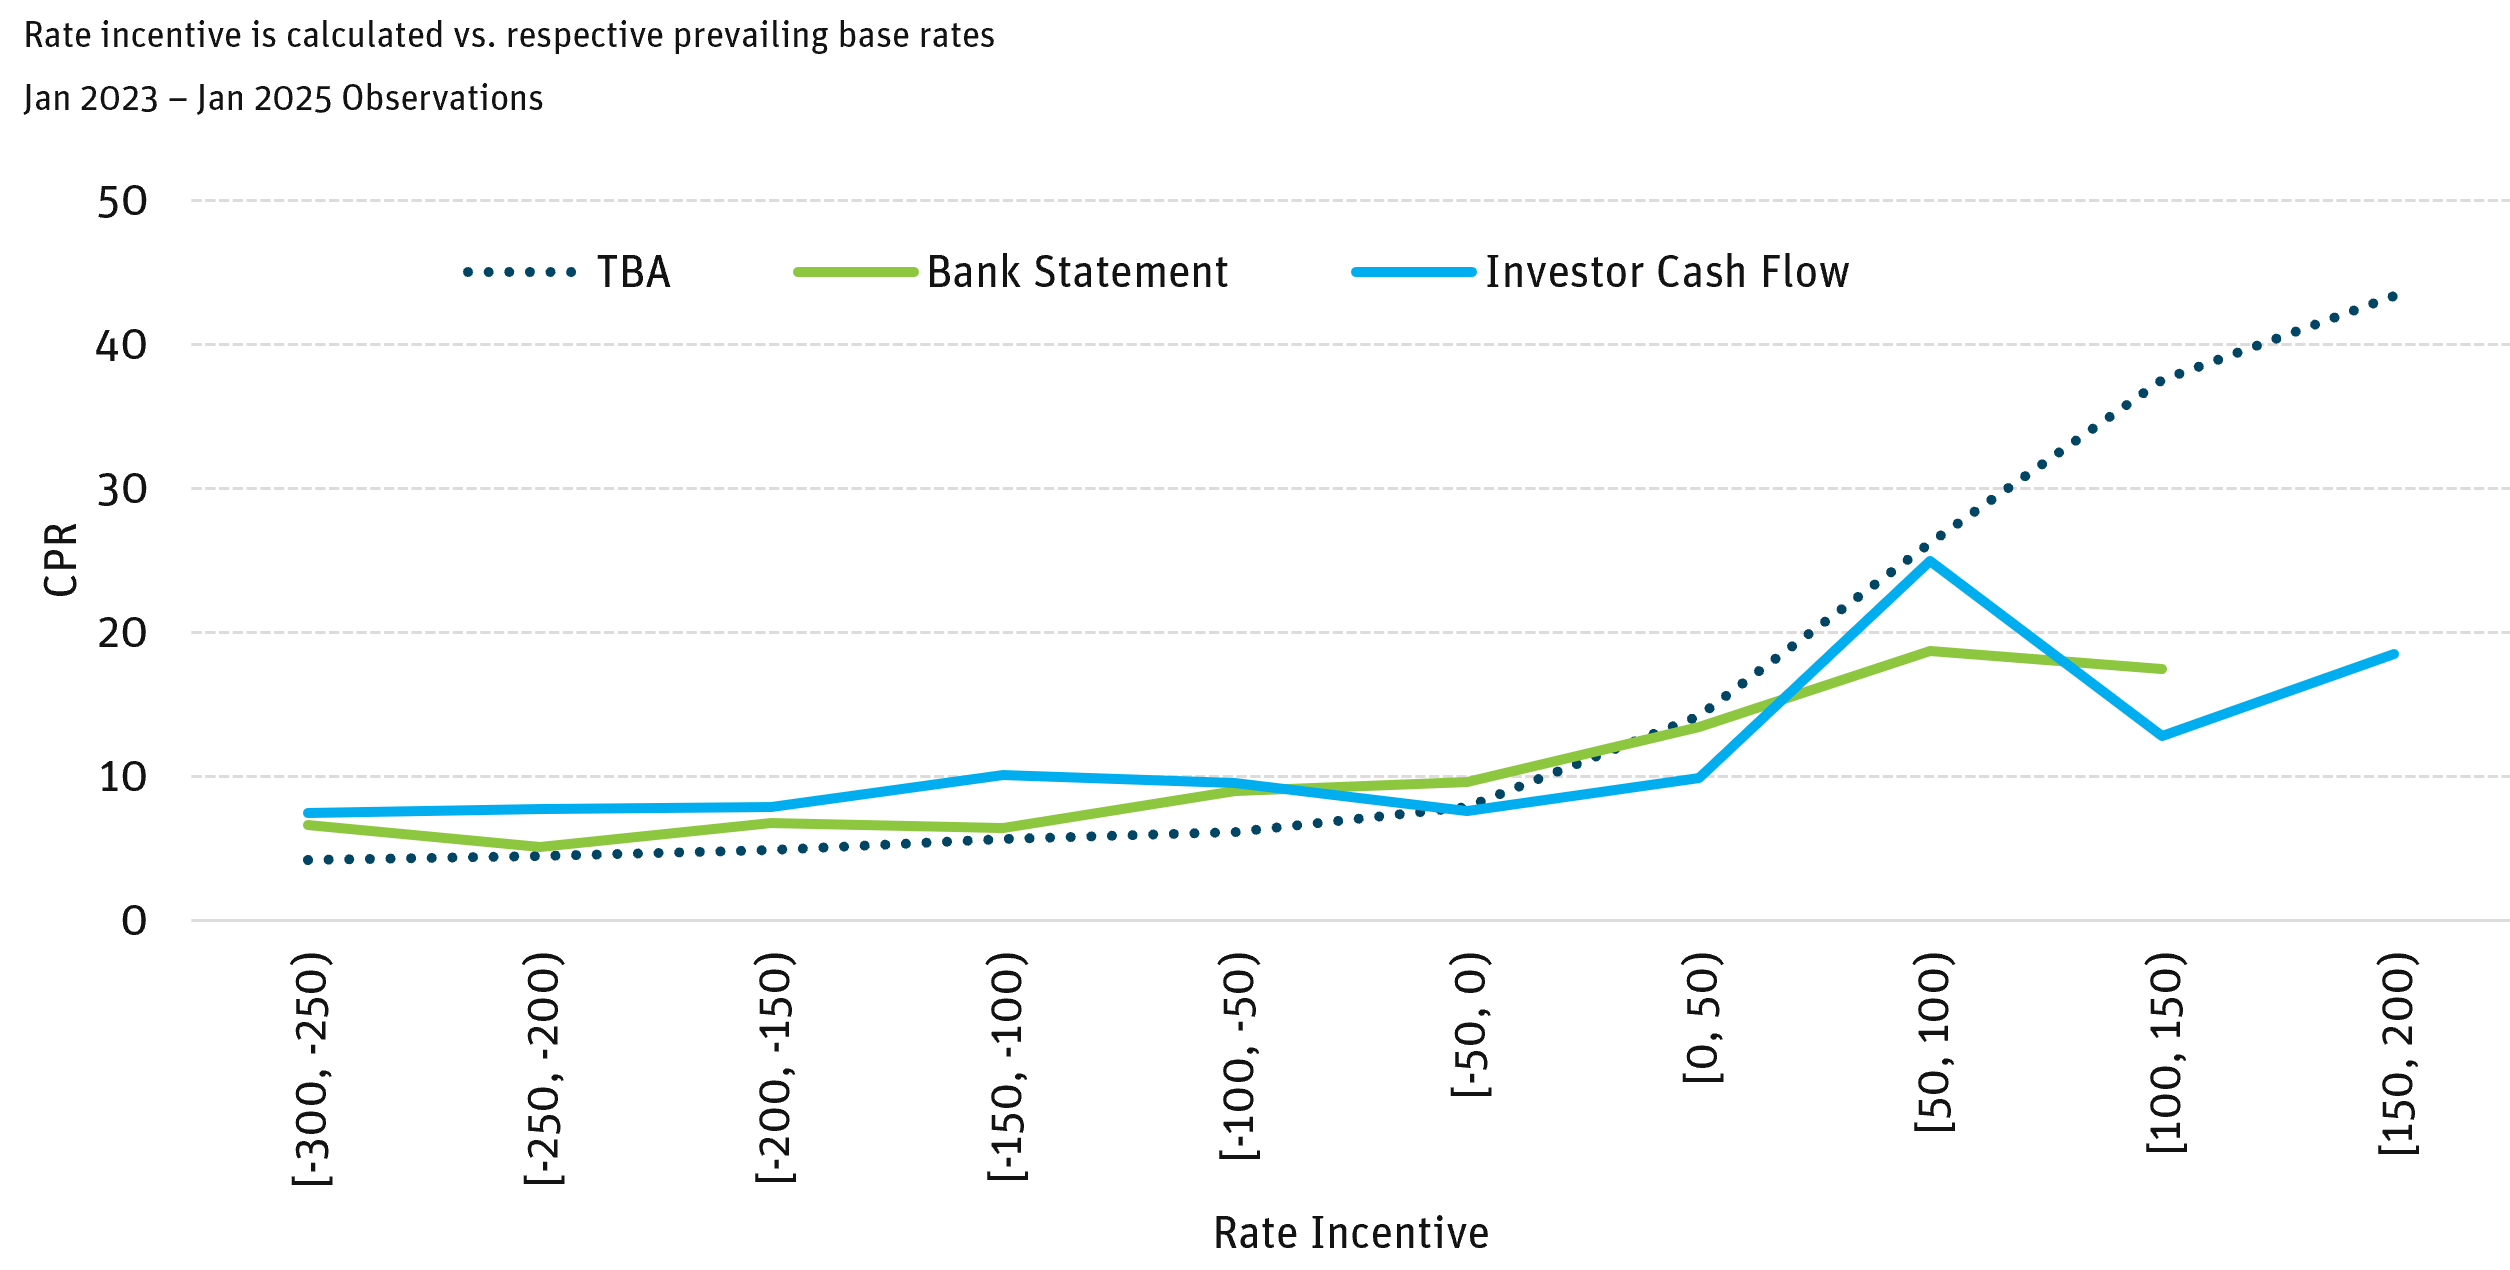
Source: Bloomberg, Fannie Mae, Freddie Mac as of April 2025.
Non-QM vs. Conventional S-Curve (13-24 Month WALA)
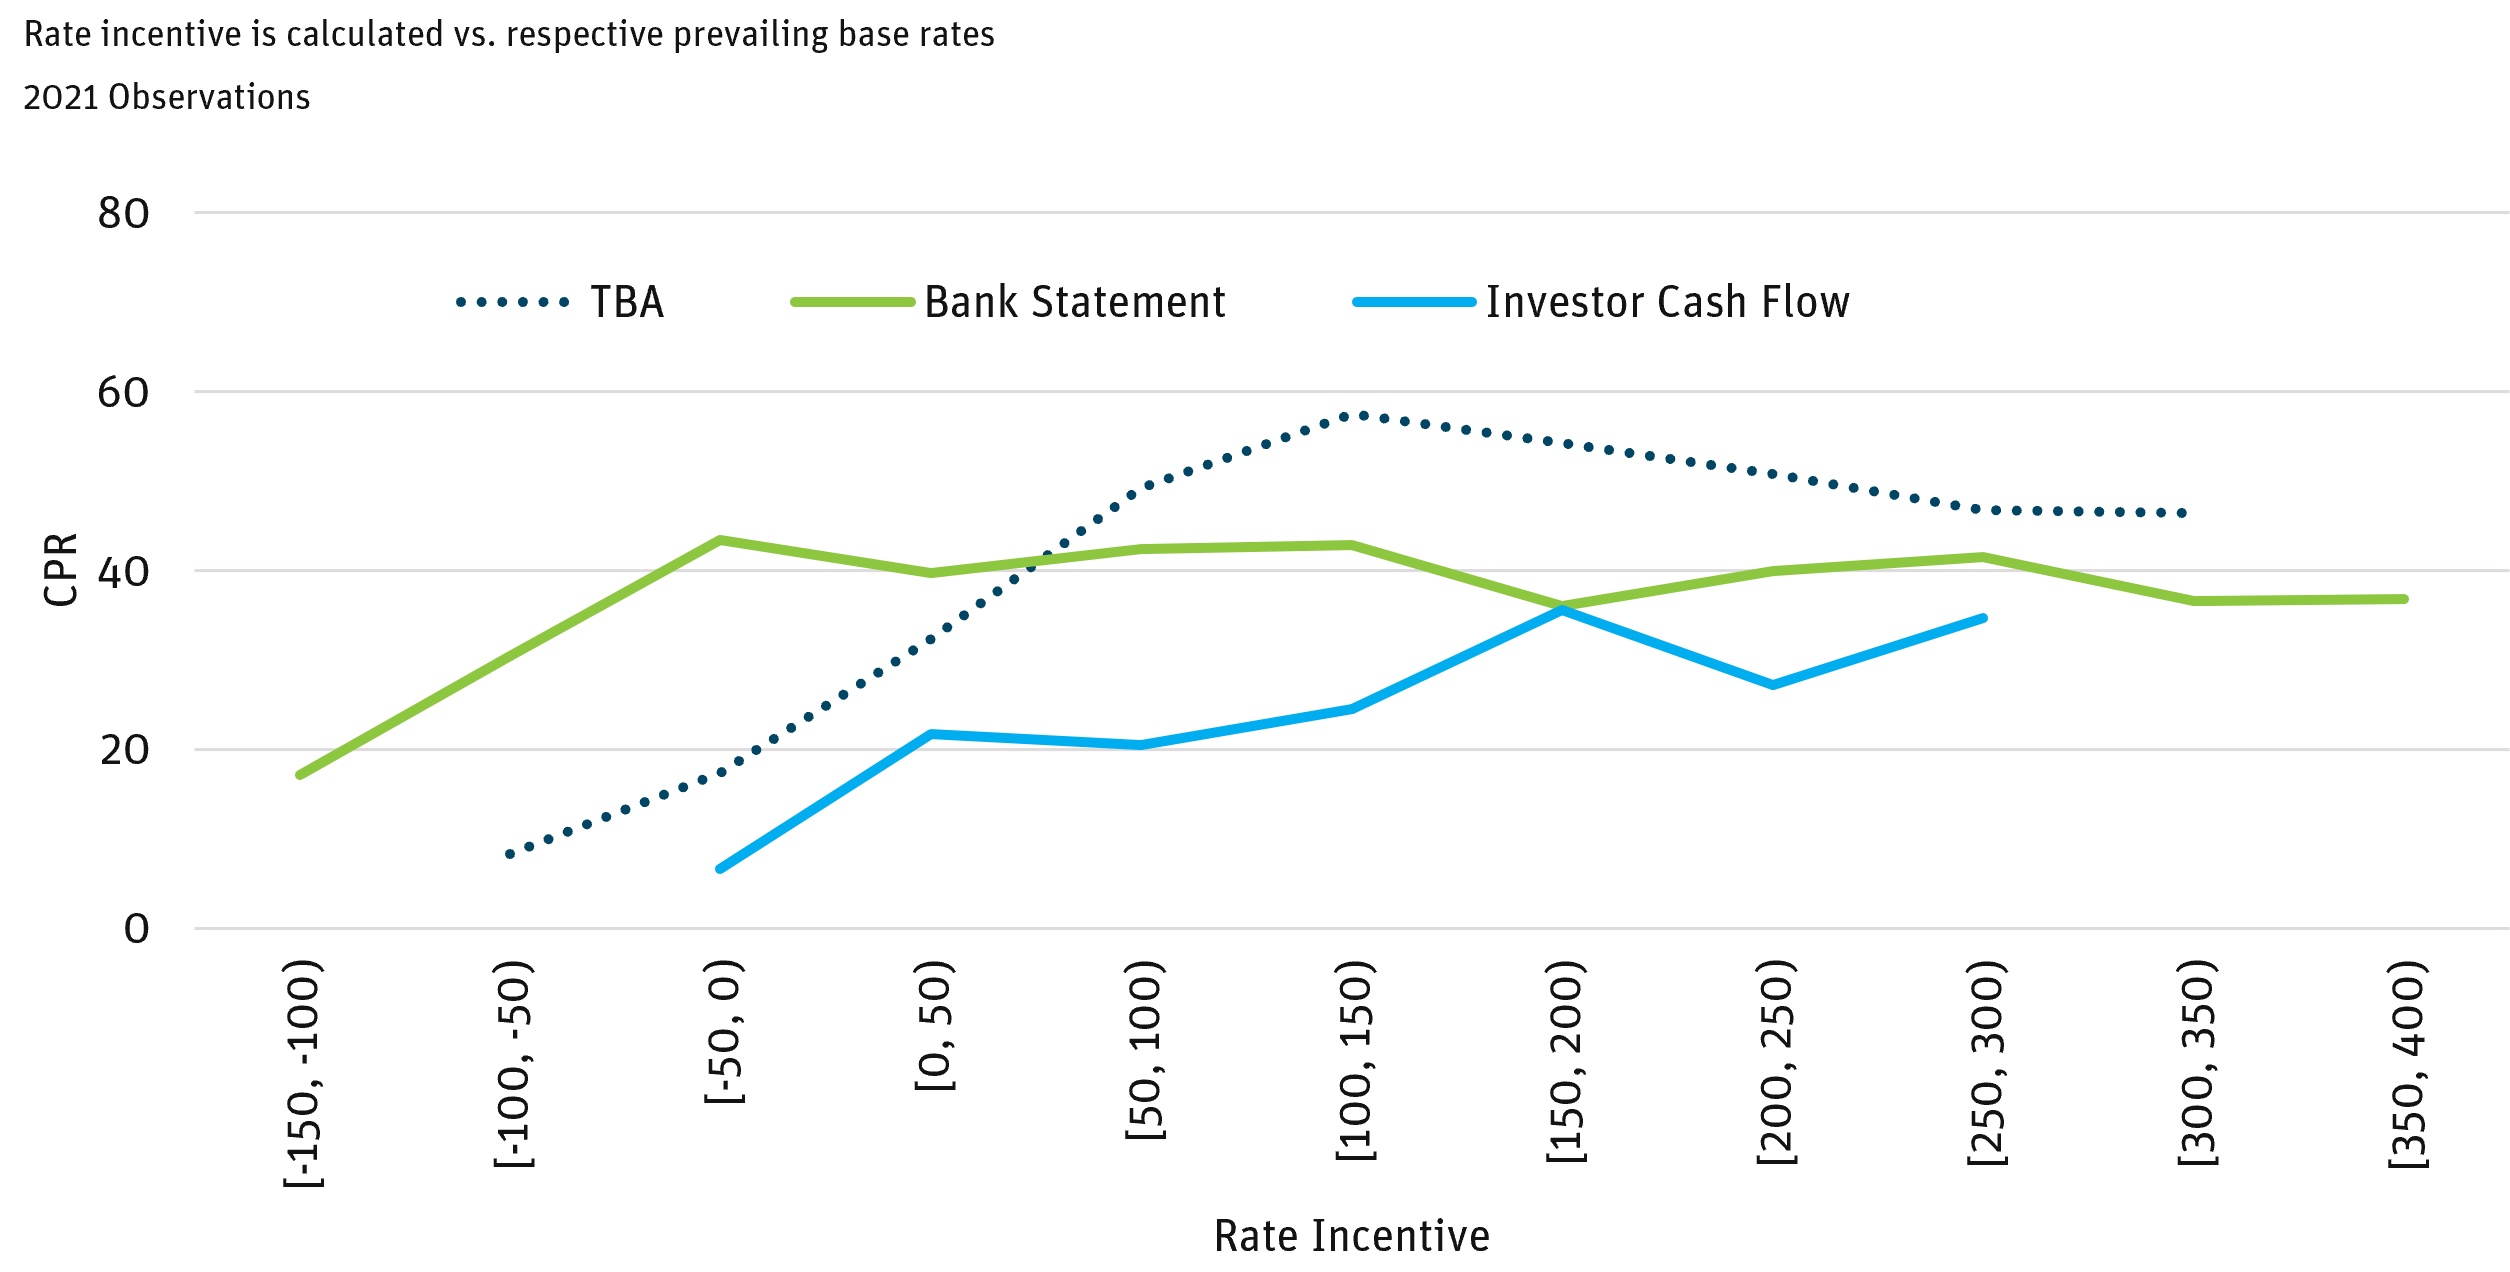
Source: Bloomberg, Fannie Mae, Freddie Mac as of April 2025.
There is no guarantee that such performance will be achieved, and actual results may vary substantially. Based upon viewpoints which may change over time, inherently involve uncertainty, and employ the use of material assumptions which may not prove accurate. Assumptions regarding yield and other potential portfolio characteristics are provided for discussion purposes only. Any actual portfolio may include material differences from this presentation. Past performance is no guarantee of future results.
The views expressed represent the opinion of Angel Oak Capital Advisors which are subject to change and are not intended as a forecast or guarantee of future results. Stated information is derived from proprietary and non-proprietary sources which have not been independently verified for accuracy or completeness. While Angel Oak Capital Advisors believes the information to be accurate and reliable, we do not claim or have responsibility for its completeness, accuracy, or reliability. Statements of future expectations, estimate, projections, and other forward-looking statements are based on available information and management’s view as of the time of these statements. Accordingly, such statements are inherently speculative as they are based on assumptions which may involve known and unknown risks and uncertainties. Actual results, performance, or events may differ materially from those expressed or implied in such statements.
All investing involves risk, including the loss of principal. There is no guarantee that investment objectives will be attained. Results may vary. There is no guarantee that risk can be managed successfully.
This document does not constitute advice or a recommendation or offer to sell or a solicitation to deal in any security or financial product. It is provided for informational purposes only and on the understanding that the recipient has sufficient knowledge and experience to be able to understand and make their own evaluation of the proposals and services described herein, any risks associated therewith and any related legal, tax, accounting or other material considerations. To the extent that the reader has any questions regarding the applicability of any specific issue discussed above to their specific portfolio or situation, prospective investors are encouraged to contact Angel Oak Capital Advisors or consult with the professional advisor of their choosing.
Except where otherwise indicated, the information contained in this presentation is based on matters as they exist as of the date of preparation of such material and not as of the date of distribution or any future date. Recipients should not rely solely on this material in making any future investment decision.
This presentation is confidential, is intended only for the person to whom it has been directly provided and under no circumstances may a copy be shown, copied, transmitted or otherwise be given to any person other than the authorized recipient without the prior written consent of Angel Oak Capital Advisors.
Specific investments described herein do not represent all investment decisions made by Angel Oak Capital Advisors. The reader should not assume that investment decisions identified and discussed were or will be profitable. Specific investment advice references provided herein are for illustrative purposes only and are not necessarily representative of investments that will be made in the future.
Past performance is no guarantee of future returns. No guarantee of investment performance is being provided and no inference to the contrary should be made.
Angel Oak Capital Advisors is a registered investment advisor. However, registration as an investment adviser with the SEC does not imply approval by the SEC or that the Adviser or its employees possess a certain level of skill or training.