2025 PERFORMANCE & 2026 OUTLOOK
Bigger dominated in 2025—and by a wide margin. Large-cap banks not only outperformed regional peers but also beat most major U.S. equity benchmarks. The KBW Bank Total Return Index (BKX) rose 32.57%, extending 2024’s 37.20% rally. Standout performers included J.P. Morgan (34.42%), Goldman Sachs (53.50%), and Citigroup (65.78%). Meanwhile, the KBW Regional Bank Total Return Index (KRX) ended the year up 6.50%, a solid outcome considering it spent much of the year in negative territory. Without the sharp late-year rally—KRX climbed nearly 15% from mid-November to mid-December—regional banks might have posted a third decline in four years.
Sentiment improved into year-end, and regional and community banks appear better positioned as several headwinds have eased. Concerns around commercial real estate, interest rates, and private credit have become less acute. The rotation into bank stocks late in the year suggests generalist investors are reengaging with a subsector that has been under-owned and underloved for years.
Despite a constructive macro backdrop, better credit trends, and—crucially—a favorable yield curve, regional banks still trade at roughly half the P/E of the S&P 500. Subordinated-debt spreads remain wide, but a strong new-issue market indicates growing demand for well-capitalized operators with both offensive capabilities such as loan growth and M&A and defensive strengths such as solid capital and liquidity. With rising margins supported by a lower fed funds rate and nearly a year of a positively sloped 2s/10s yield curve (Figure 1), banks appear positioned for mid-to-high-single-digit earnings growth.
Figure 1: Re-Steepening of the U.S. 2s/10s Yield Curve
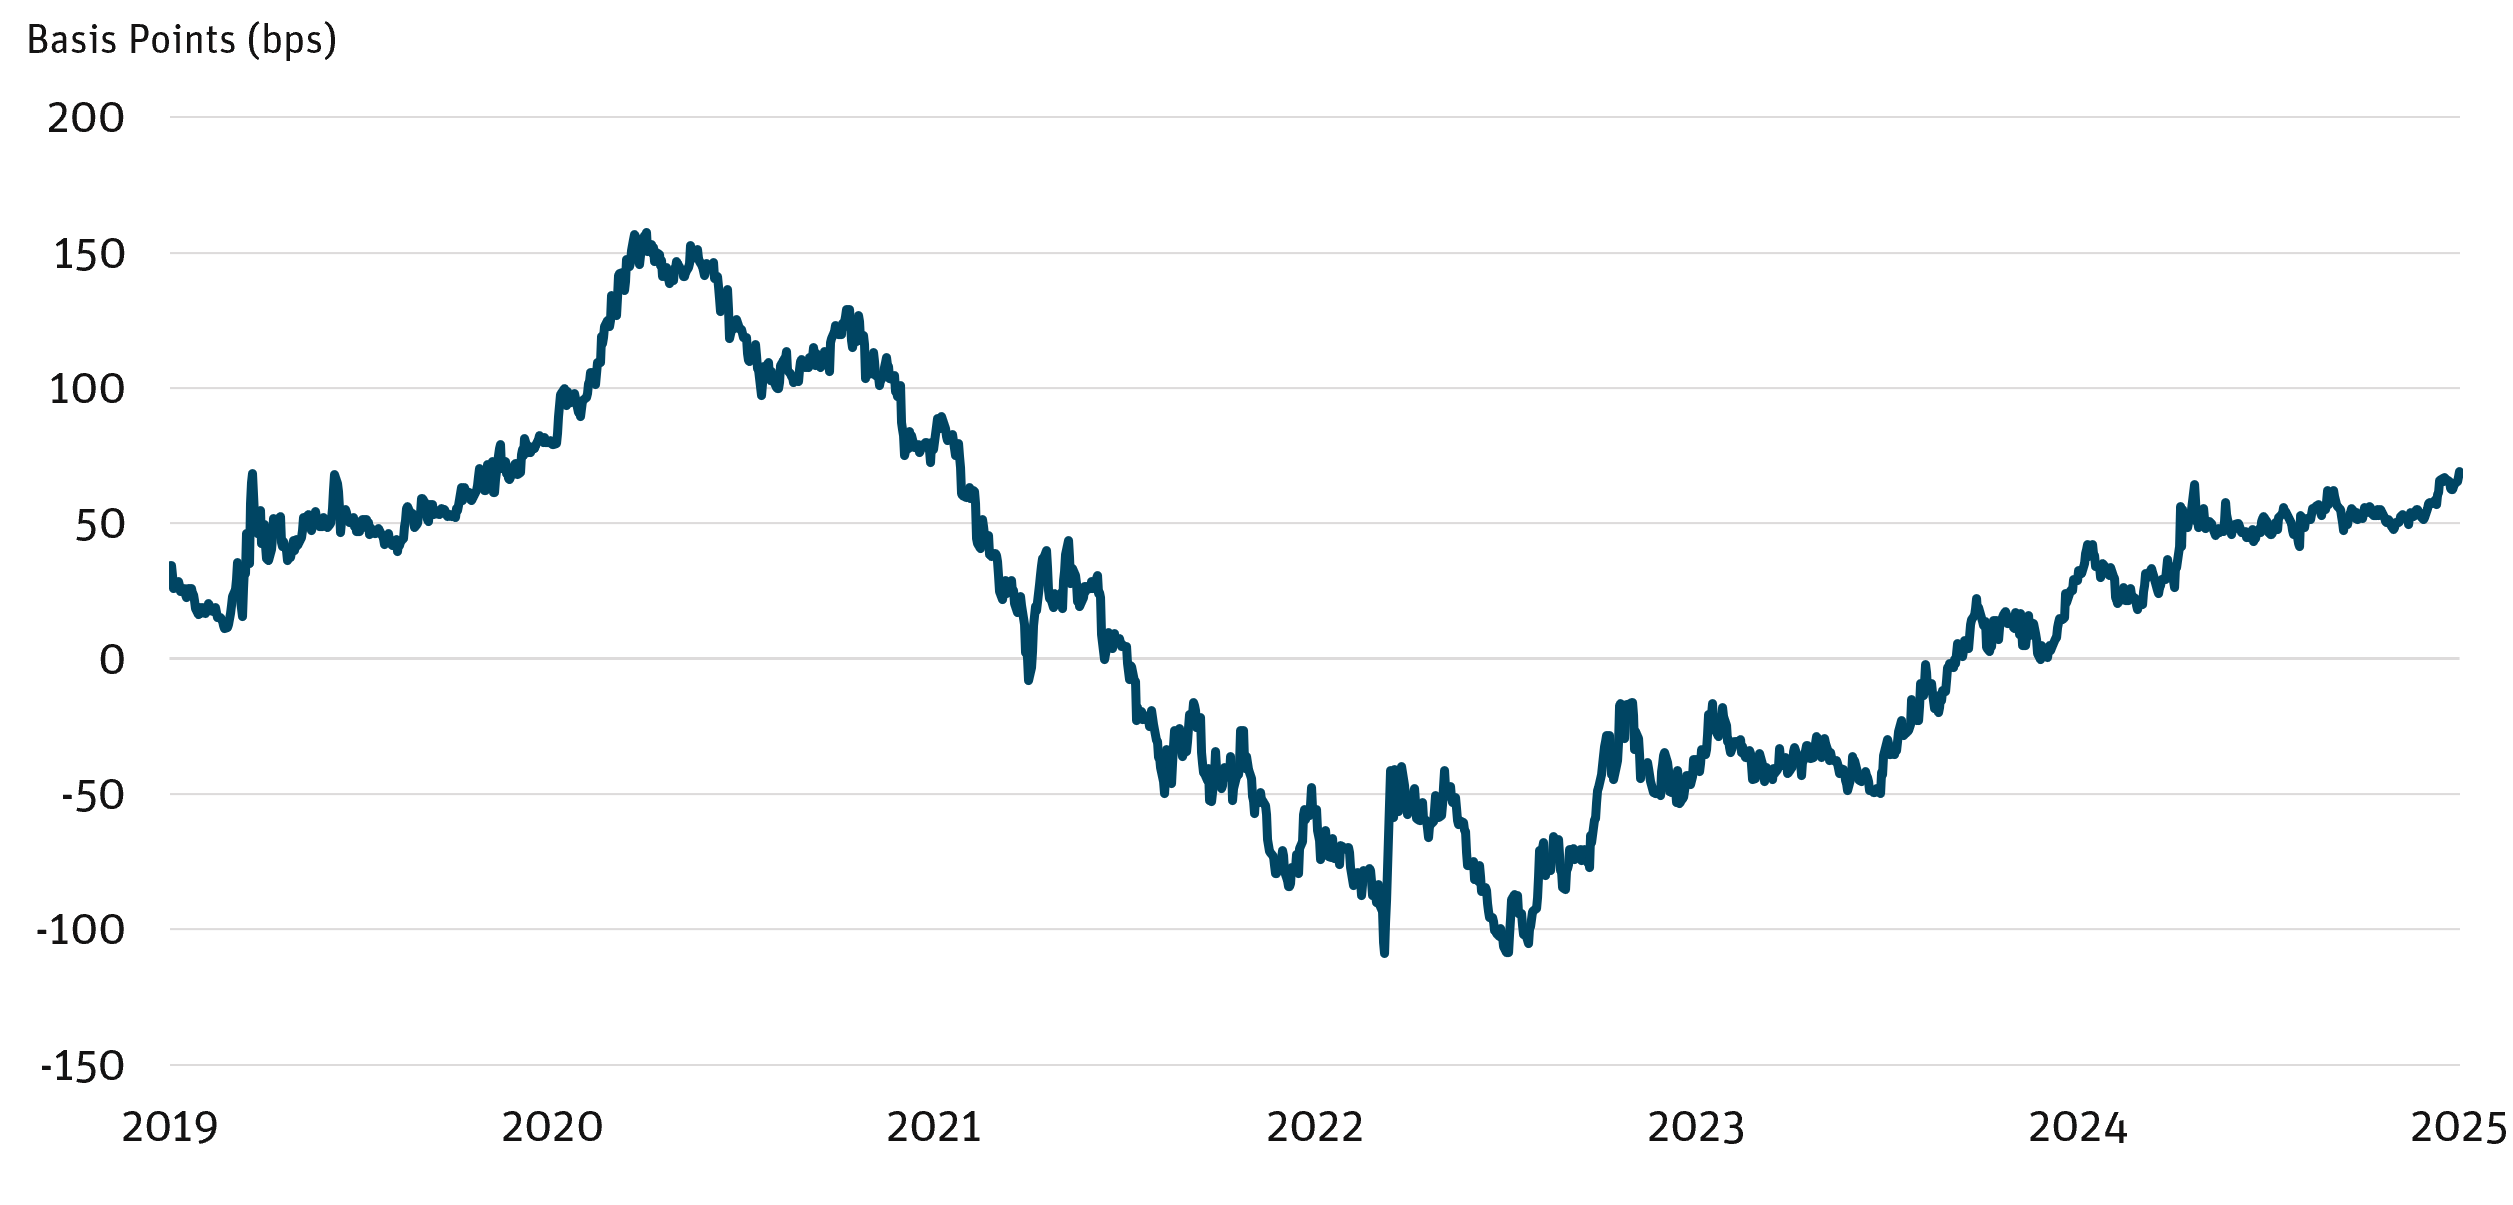
Source: Bloomberg as of 12/31/25.
WHY SMALLER COULD SHINE IN 2026
After a standout year for big-bank fee businesses, 2026 may be a year that rewards “boring.” Smaller banks typically generate about 80% of revenue from spread-based businesses, and easing cycles generally support both net interest income and credit quality. Banks are also noting early signs of stabilization in previously stressed pockets, including urban office. If current trends in rates, credit, and the domestic economy hold, smaller banks may rebound from multiyear valuation troughs and begin to close the performance gap.
HISTORY POINTS TO A VALUATION REBOUND
History suggests room for a valuation reset. From 2016 to 2018, when the 2s/10s yield curve averaged 76 bps—roughly where it ended 2025—the KRX traded around 16x earnings (Figure 2). This is approximately five turns above current consensus 2026 estimates and about three turns above today’s multiple relative to long-term norms.
Figure 2: KRX Valuations Relative to Long-Term Averages
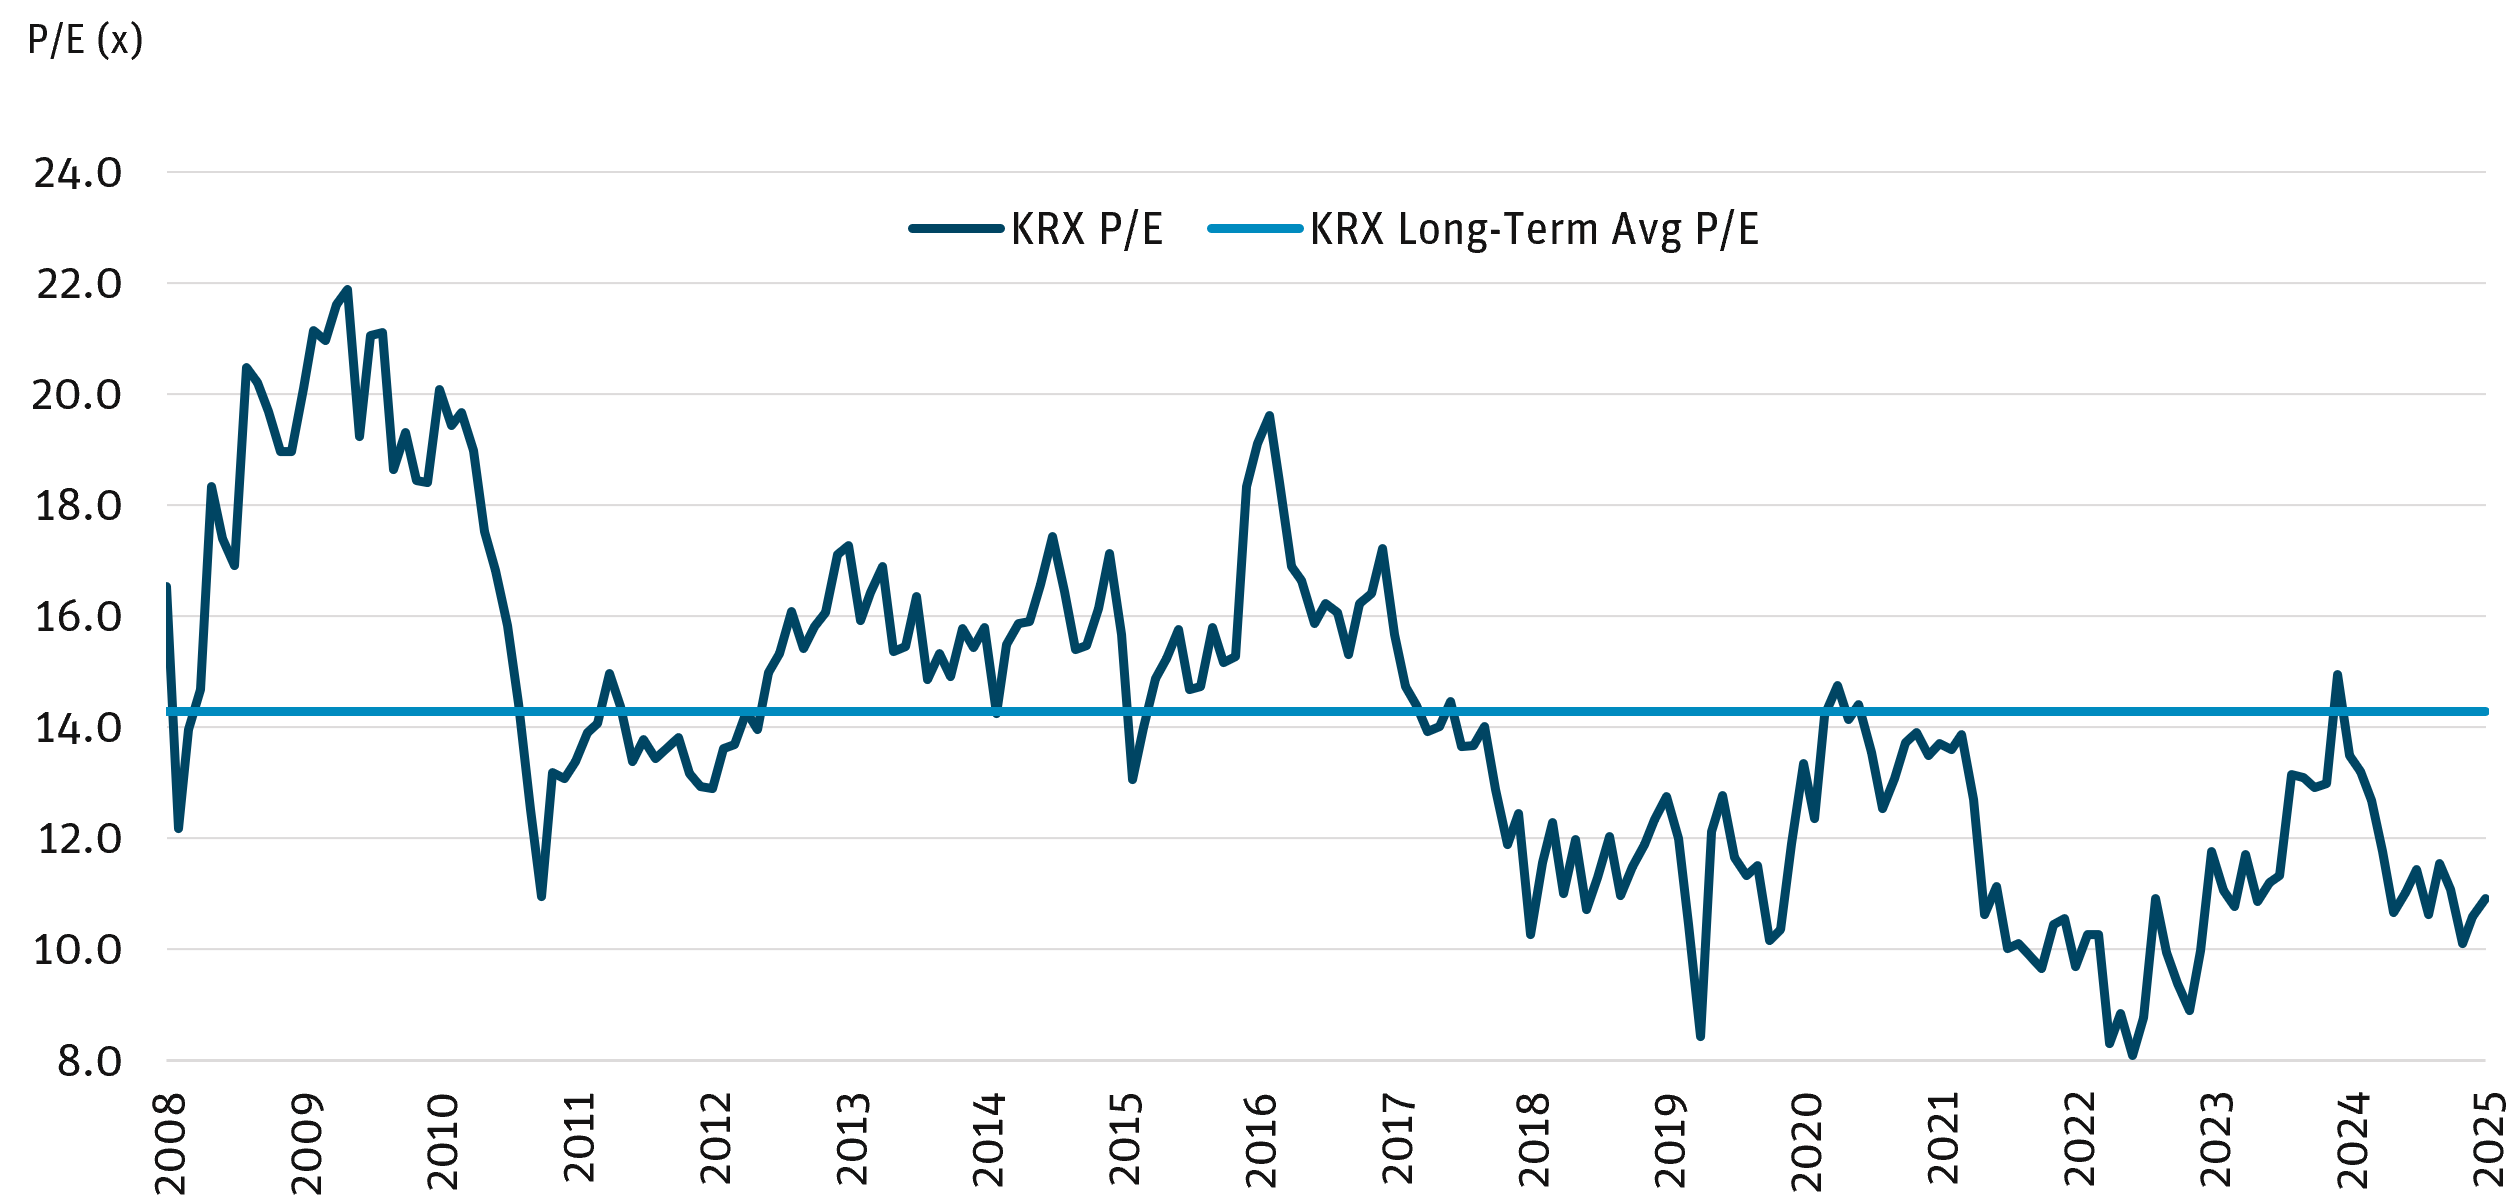
Source: KBW Research as of 12/31/25.
In 2021, with the yield curve averaging 117 bps, the KRX traded at 13–14x earnings, and analysts continued to raise estimates despite a near-record 36.65% total return. Periods of extended underperformance can create opportunity, and today’s backdrop favors regional banks that have proven playbooks for this point in the cycle.
POSITIONING FOR THE NEXT PHASE OF THE CYCLE
Banks emerged from the 2023 liquidity shock with more discipline and a stronger focus on balance-sheet structure. Even so, regional banks continue to carry a lingering stigma, reflected in muted equity valuations and wider credit spreads. The KRX enters 2026 at about 11x forward earnings, a significant discount to the broader market and 28% below its long-term average. While the full sector benefits from the current rate environment, regional banks remain the most direct way to express the theme.
Management teams are growing core deposits and reducing excess liquidity, which supports both earnings and book value. Capital return is back, with buybacks and dividend increases reappearing as banks combine strong capital, ample liquidity, and disciplined growth to take advantage of new opportunities. In a long-running equity bull market that may be losing momentum, regional banks still offer a rare value proposition.
BOTTOM LINE
Large-cap banks have led performance recently, but the next 18–24 months could mark the turning point for regional banks. With cleaner balance sheets, improving margins, and valuations near decade lows, the risk-reward is compelling. This remains one of the few areas where fundamentals, sentiment, and the macro environment are aligned. Even a modest recovery in today’s historically wide valuation discount could unlock meaningful upside, potentially resulting in double-digit annualized returns. As investors look for what comes next, regional banks may prove to be one of the clearest and most overlooked opportunities ahead.
DEFINITIONS AND DISCLOSURES
2s/10s Curve: The difference between the 10-year Treasury rate and the 2-year Treasury rate.
Basis Point (bps): One hundredth of one percent and is used to denote the percentage change in a financial instrument.
Credit Spread: The difference in yield between two bonds of similar maturity but different credit quality.
KBW Bank Index (BKX): The index is designed to track the performance of the leading banks and thrifts that are publicly traded in the U.S.
KBW Regional Banking Index (KRX): The index seeks to reflect the performance of U.S. companies that do business as regional banks or thrifts.
M&A: Mergers and acquisitions.
Net Interest Income (NII): The difference between the revenue generated from a bank’s interest-bearing assets and expenses incurred while paying its interest-bearing liabilities.
Price/Earnings (P/E) Ratio: The ratio of a company’s stock price to the company’s earnings per share.
Subordinated-Debt Spreads: The yield difference between subordinated (lower-priority) debt and comparable senior or risk-free debt.
Yield Curve: The U.S. Treasury yield curve refers to a line chart that depicts the yields of short-term Treasury bills compared to the yields of long-term Treasury notes and bonds. The slope, shape, and level of yield curves may vary over time with changes in interest rates.
It is not possible to invest directly in an index.
Must be preceded or accompanied by a prospectus. To obtain an electronic copy of the prospectus, please visit www.angeloakcapital.com.
Opinions expressed are as of 1/31/26 and are subject to change at any time, are not guaranteed, and should not be considered investment advice.
Investing involves risk; principal loss is possible. Investments in debt securities typically decrease when interest rates rise. This risk is usually greater for longer-term debt securities. Investments in lower-rated and non-rated securities present a greater risk of loss to principal and interest than do higher-rated securities. Investments in asset-backed and mortgage-backed securities include additional risks that investors should be aware of, including credit risk, prepayment risk, possible illiquidity and default, as well as increased susceptibility to adverse economic developments. Derivatives involve risks different from—and in certain cases, greater than—the risks presented by more traditional investments. Derivatives may involve certain costs and risks such as illiquidity, interest rate, market, credit, management and the risk that a position could not be closed when most advantageous. Investing in derivatives could lead to losses that are greater than the amount invested. The Fund may make short sales of securities, which involves the risk that losses may exceed the original amount invested. The Fund may use leverage, which may exaggerate the effect of any increase or decrease in the value of securities in the Fund’s portfolio or the Fund’s net asset value, and therefore may increase the volatility of the Fund. Investments in foreign securities involve greater volatility and political, economic and currency risks and differences in accounting methods. These risks are increased for emerging markets. Investments in fixed-income instruments typically decrease in value when interest rates rise. The Fund will incur higher and duplicative costs when it invests in mutual funds, ETFs and other investment companies. There is also the risk that the Fund may suffer losses due to the investment practices of the underlying funds. For more information on these risks and other risks of the Fund, please see the Prospectus.
Past performance does not guarantee future results. Index performance is not indicative of Fund performance. Current Fund performance can be obtained by calling 855-751-4324.
A full list of fund holdings can be found at www.angeloakcapital.com/resources and are subject to risk and to change at any time. Any discussion of individual companies is not intended as a recommendation to buy, hold, or sell securities issued by those companies.
The Angel Oak Funds are distributed by Quasar Distributors, LLC.
© 2026 Angel Oak Capital Advisors, which is the adviser to the Angel Oak Funds.