On December 18, 2024, the Federal Reserve announced a 25 basis point cut to the Fed’s target range from 4.50%-4.75% to 4.25%-4.50%. This decision was supported by sustained strength in labor markets and the progress achieved in bringing inflation down toward the Fed’s 2% target for the PCE inflation index.
The announcement also indicated that the Fed would continue reducing its holdings of Treasuries, agency debt, and agency MBS. These actions are widely expected to steepen the yield curve throughout 2025, a favorable outcome that should lead to tighter spreads on MBS, which are currently trading wide of corporates with equivalent ratings.
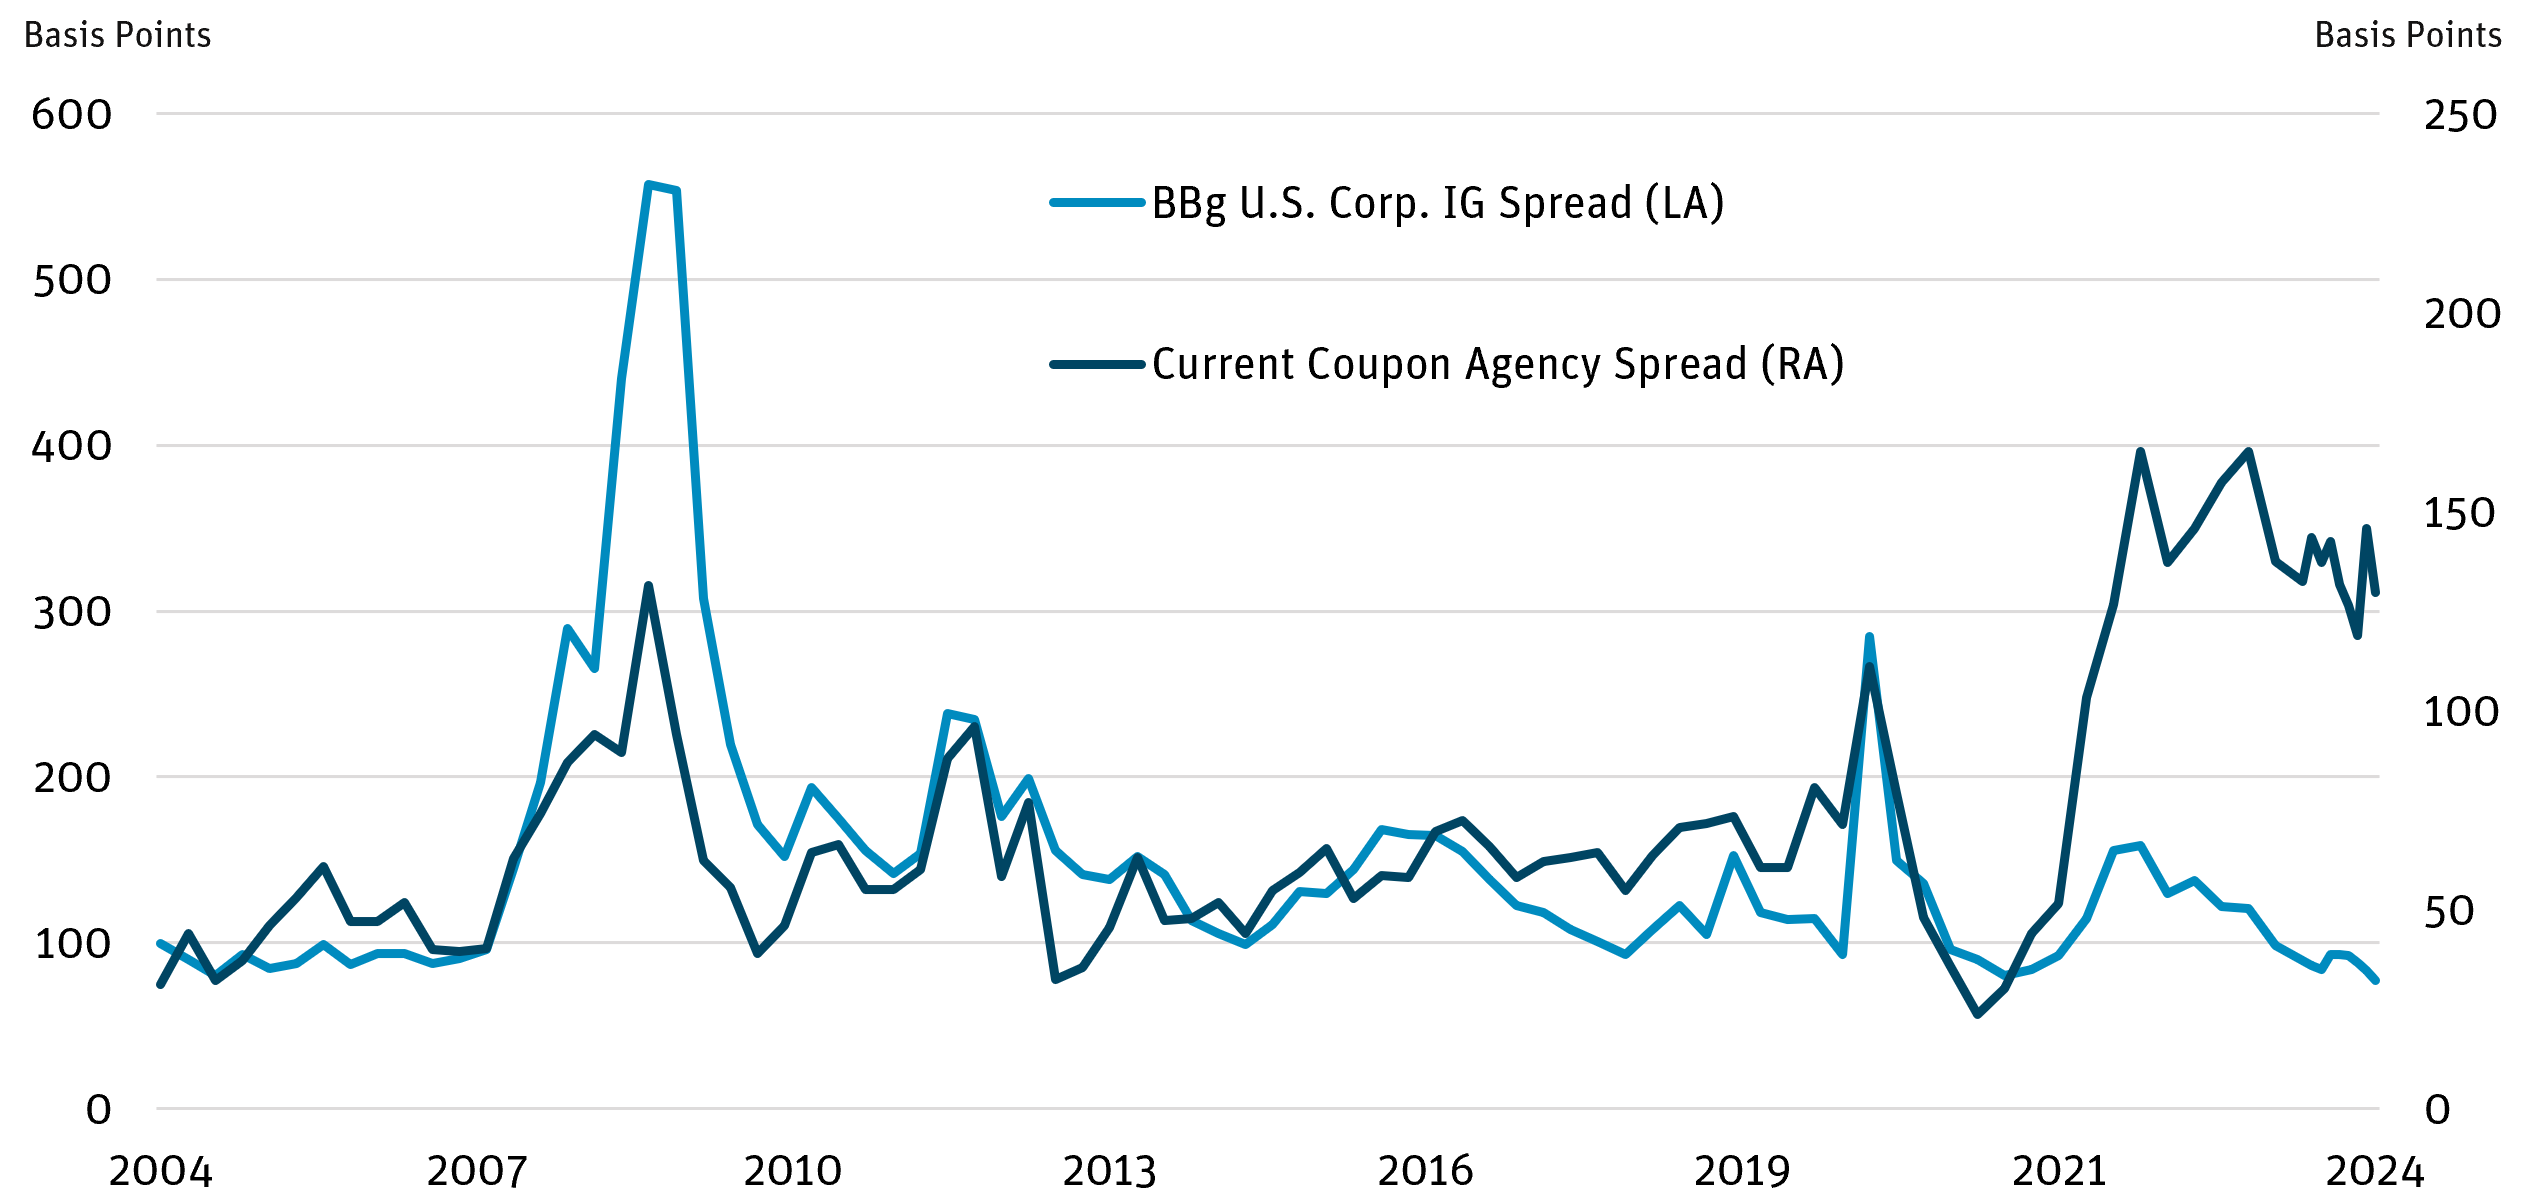
Figure 1 shows spreads in agency RMBS trading significantly wider than investment-grade (IG) corporate credit for the first time in more than 20 years. Corporate credit spreads (both IG and high yield) are trading at cyclical tights with less relative value versus RMBS securities that are trading wider than historical averages (Figure 2).
Figure 1: Current Coupon Agency Spread Wider Than IG Corp. Spread

Source: Bloomberg as of 11/30/24.
Market Dislocation Opportunity:
- The Federal Reserve’s move to tighten monetary policy in 2022 and the three subsequent regional bank failures resulted in two of the natural buyers of RMBS — the Fed and banks — exiting this asset class.
- This weakening technical demand has resulted in significantly widened RMBS spreads versus corporates (Figure 2), presenting an attractive opportunity for investors to increase MBS weightings in allocations.
Figure 2: Historical Spreads

Source: Bloomberg, Wells Fargo, Bank of America as of 11/30/24.
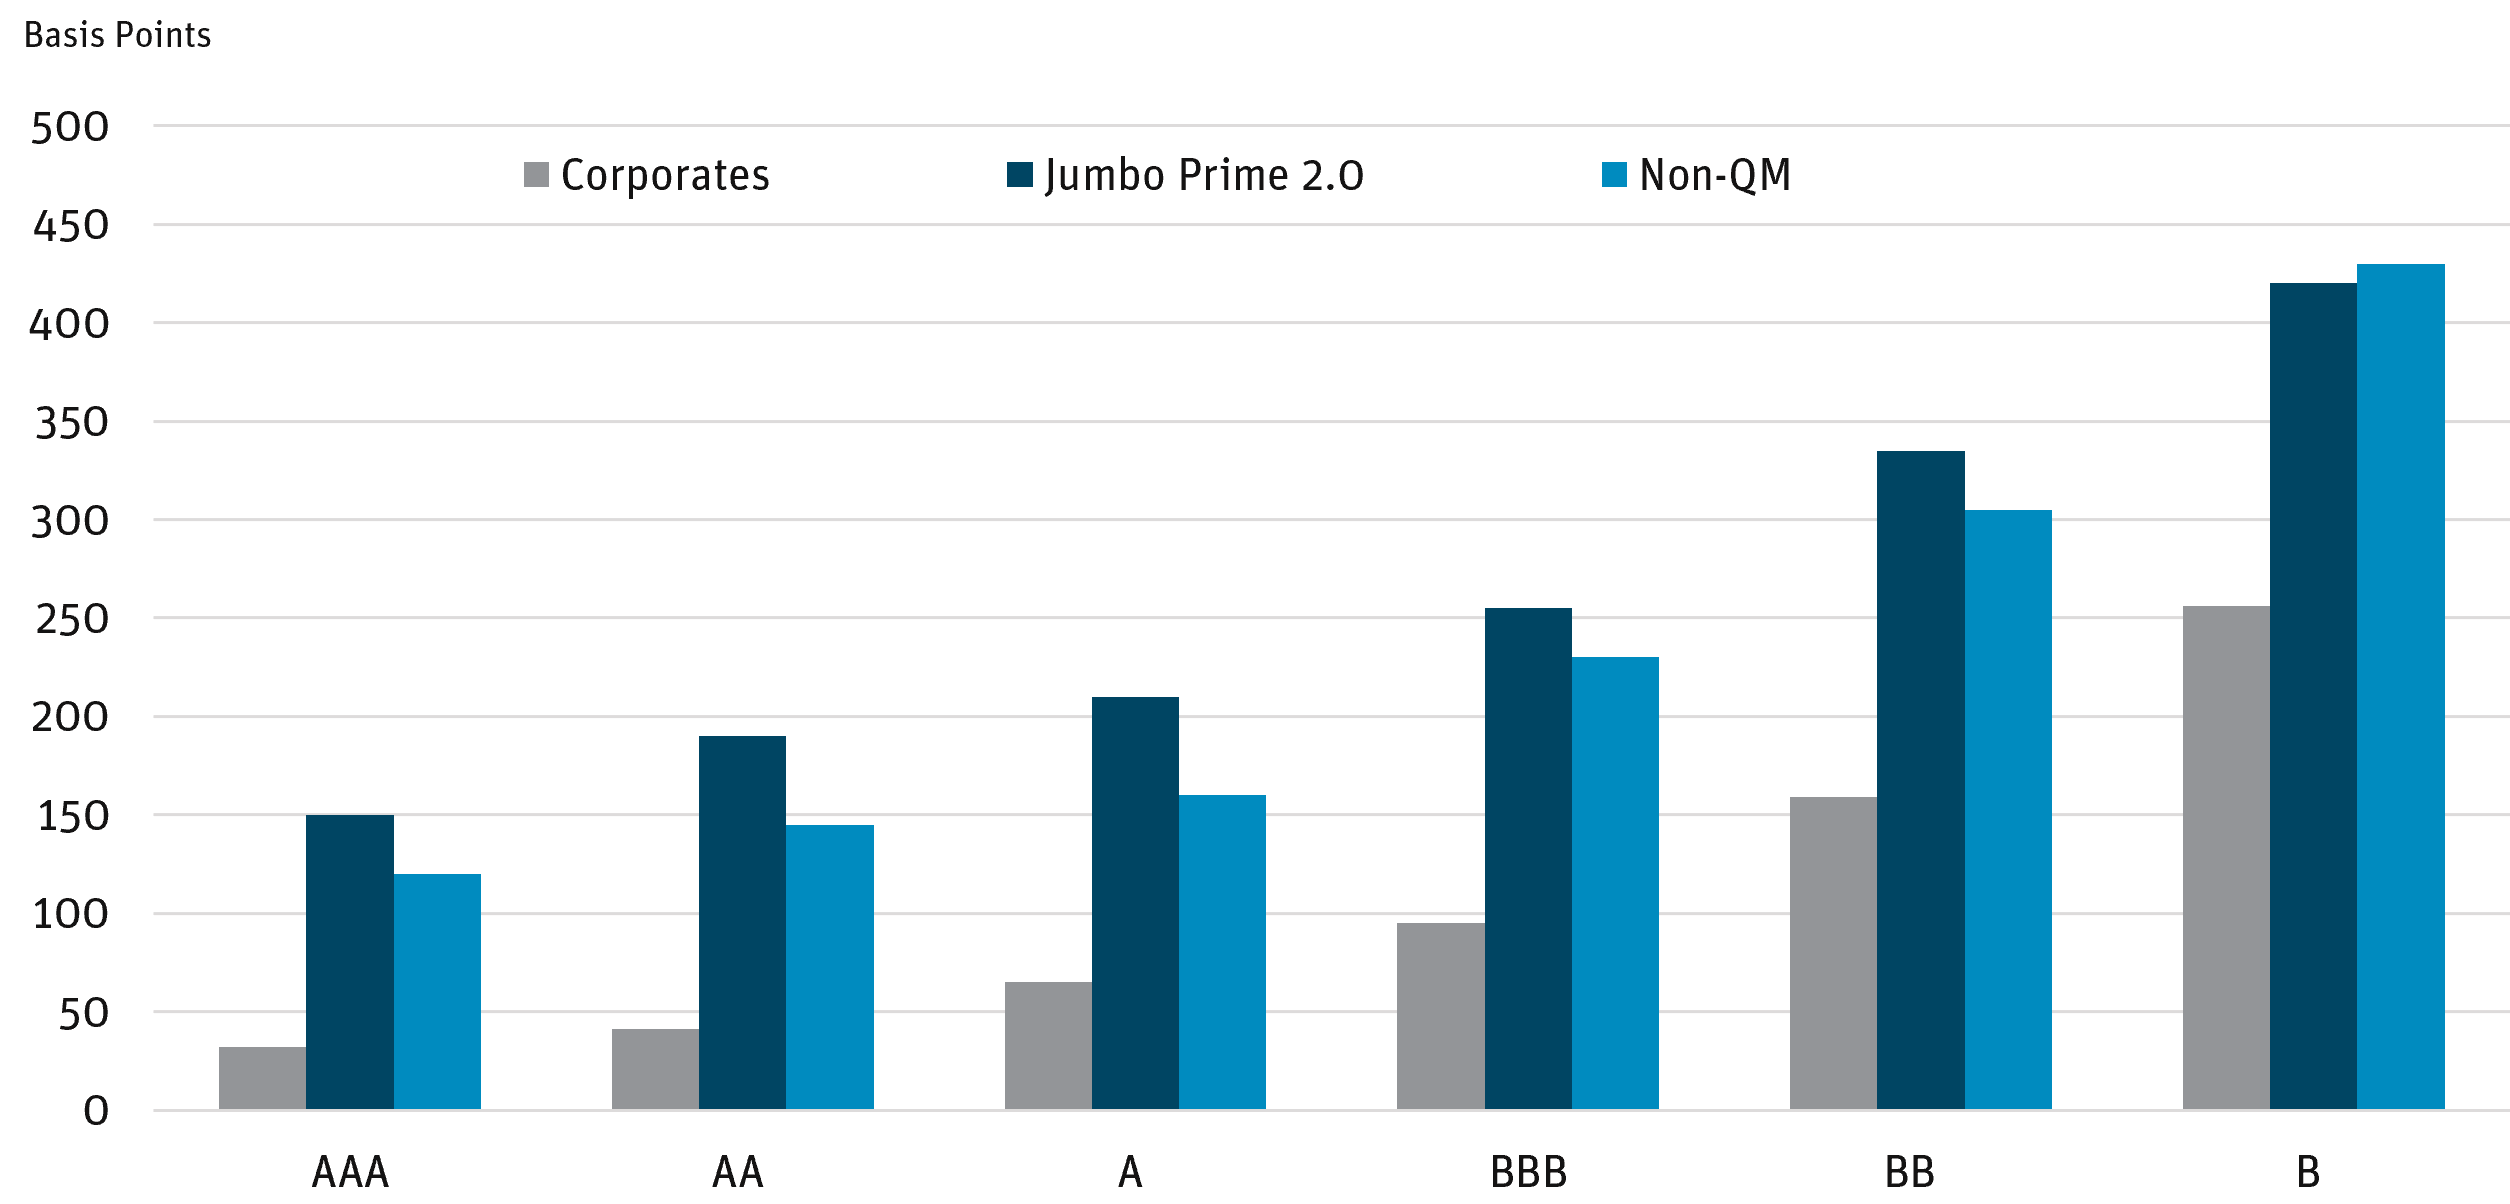
- Agency RMBS have explicit or implicit default protection by the U.S. government, unlike corporate debt. Although agency MBS are historically attractive, investors may find the best relative value within NA RMBS (Figure 3).
- As spreads revert to historical norms, we see more upside price potential in NA RMBS. Lower rates also generally accelerate prepayments, which would be yield-accretive to investors holding RMBS trading at current discounts.
Figure 3: Non-Agency vs. Corporate Spreads

Source: Bloomberg as of 11/30/24.
DEFINITIONS AND DISCLOSURES
Agency Mortgage-Backed Securities (AMBS): Securities issued or guaranteed by the U.S. government or a GSE.
Basis Point (bps): One hundredth of one percent and is used to denote the percentage change in a financial instrument.
Bloomberg U.S. Corporate High Yield Bond Index: An unmanaged market value-weighted index that covers the universe of fixed-rate, non-investment-grade debt.
Bloomberg U.S. Corporate Investment Grade Index: An index that measures the investment grade, fixedrate, taxable corporate bond market. It includes USD-denominated securities publicly issued by U.S. and non-U.S. industrial, utility and financial issuers.
Current Coupon: Refers to a security that is trading closest to its par value without going over par. In other words, the bond’s market price is at or near to its issued face value.
Duration: Measures a portfolio’s sensitivity to changes in interest rates. Generally, the longer the duration, the greater the price change relative to interest rate movements.
Morgan Stanley 30Y Conventional Current Coupon ($100) ZV Index: The index represents the ZV (zero volatility) spread for the hypothetical $100-priced 30-year conventional mortgage over time.
Mortgage-Backed Security (MBS): A type of asset-backed security which is secured by a mortgage or collection of mortgages.
Non-Qualified Mortgage (Non-QM): A loan that does not meet the standards of a qualified mortgage and uses non-traditional methods of income verification to help a borrower get approved for a home loan.
Prime Jumbo: Prime jumbo mortgages are non-agency loans typically because the lending amount exceeds the conforming loan limits. These tend to be high-quality mortgages with high credit scores that, for the most part, comply with agency mortgage underwriting guidelines.
Spread: The difference in yield between a U.S. Treasury bond and a debt security with the same maturity but of lesser quality.
Yield Curve: The U.S. Treasury yield curve refers to a line chart that depicts the yields of short-term Treasury bills compared to the yields of long-term Treasury notes and bonds.
Opinions expressed are as of 12/18/24 and are subject to change at any time, are not guaranteed, and should not be considered investment advice.
Investing involves risk; principal loss is possible. Investments in debt securities typically decrease when interest rates rise. This risk is usually greater for longer- term debt securities. Investments in lower-rated and nonrated securities present a greater risk of loss to principal and interest than do higher-rated securities. Investments in asset-backed and mortgage-backed securities include additional risks that investors should be aware of, including credit risk, prepayment risk, possible illiquidity and default, as well as increased susceptibility to adverse economic developments. Derivatives involve risks different from — and in certain cases, greater than — the risks presented by more traditional investments. Derivatives may involve certain costs and risks such as illiquidity, interest rate, market, credit, management and the risk that a position could not be closed when most advantageous. Investing in derivatives could lead to losses that are greater than the amount invested. The Fund may make short sales of securities, which involves the risk that losses may exceed the original amount invested. The Fund may use leverage, which may exaggerate the effect of any increase or decrease in the value of securities in the Fund’s portfolio or the Fund’s net asset value, and therefore may increase the volatility of the Fund. Investments in foreign securities involve greater volatility and political, economic and currency risks and differences in accounting methods. These risks are increased for emerging markets. Investments in fixed-income instruments typically decrease in value when interest rates rise. The Fund will incur higher and duplicative costs when it invests in mutual funds, ETFs and other investment companies. There is also the risk that the Fund may suffer losses due to the investment practices of the underlying funds. For more information on these risks and other risks of the Fund, please see the Prospectus.
Investors should carefully consider the investment objectives, risks, charges and expenses of the Angel Oak Funds. This and other important information about each Fund is contained in the Prospectus or Summary Prospectus for each Fund, which can be obtained by calling 855-751-4324 or by visiting www.angeloakcapital.com. The Prospectus or Summary Prospectus should be read carefully before investing.
Index performance is not indicative of Fund performance. Past performance does not guarantee future results. Current performance can be obtained by calling 855-751-4324.
The Angel Oak Funds are distributed by Quasar Distributors, LLC.
© 2024 Angel Oak Capital Advisors, which is the adviser to the Angel Oak Funds.
