
KEY TAKEAWAYS
- Non-QM is a scalable core allocation within alternative credit and real estate debt portfolios. The Non-QM market is expected to reach approximately $175 billion in origination volume this year, putting it on pace to exceed last year’s total by more than 60%, according to Bank of America research. Increased supply has been met with strong investor demand.
- Solid credit performance and disciplined underwriting have helped de-risk the asset class. However, dispersion among market participants is increasing, particularly with respect to collateral composition and securitization execution.
- Investor participation in the sector continues to broaden. Investors fall into three categories: those that prefer whole loans, those seeking senior bonds within fixed income portfolios, and those allocating to junior bonds in pursuit of higher returns within real estate debt and asset-backed finance strategies.
- In our view, Non-QM offers attractive risk-adjusted yields, driven primarily by market complexity and relative scarcity compared to other areas of the credit markets.
NON-QM IS NOW MAINSTREAM
The Non-QM sector has evolved from a niche alternative loan product into a structural pillar of the U.S. credit markets. The market encompasses a range of loan products differentiated by borrower profile, occupancy status, and underwriting methodology.
A significant segment of the Non-QM market, and one of Angel Oak’s primary areas of focus, is providing mortgages to self-employed individuals and small-business owners. These Bank Statement mortgages serve borrowers who qualify using alternative income documentation, including bank statements. This segment has benefited from workforce shifts toward self-employment and gig economy participation, where borrowers often have more complex income streams. More than 27 million new business applications were filed in the U.S. over the past five years, the highest total recorded for any five-year period. Entrepreneurs have been filing approximately 460,000 new business applications per month, nearly double pre-pandemic levels. Various surveys point to continued growth in freelance work, with a 2025 MBO Partners study estimating approximately 73 million U.S. independent workers, compared to 41 million in 2019.
Investor/Debt Service Coverage Ratio (DSCR) loans are mortgages made to real estate investors financing single-family rental properties. These borrowers are qualified based on a property’s rental income, along with their credit score (i.e., FICO) and loan-to-value (LTV) ratio. The mortgages are non-owner occupied and can carry prepayment penalties, which may reduce prepayment risk and provide some downside protection in falling-rate environments. More than 80% of the U.S. rental housing supply is owned by individuals with one to 10 properties, rather than institutions, and Investor/DSCR mortgages cater to this segment. The lack of starter-home inventory and the challenges facing first-time homebuyers amid affordability pressures have been well documented, and the Investor/DSCR market helps address that challenge by providing financing to landlords. In 2025, the average loan size of Angel Oak’s Investor/DSCR mortgages was approximately $350,000, compared to $750,000 for owner-occupied Non-QM mortgages.
Growth in the Non-QM market has been fueled by several factors, including the sector’s strong credit performance and investor demand for housing-related assets. As shown in Figure 1, credit losses have remained negligible for both Angel Oak and the broader sector. In addition to strong credit performance and resulting investor demand, the composition of underlying borrowers has evolved over the past five years. The most notable shift has been the growth of Investor/DSCR loans, which now constitute approximately 50% of all Non-QM securitized collateral, roughly double the percentage in 2020, as shown in Figure 2.
Figure 1: Non-QM Cumulative Losses by Vintage
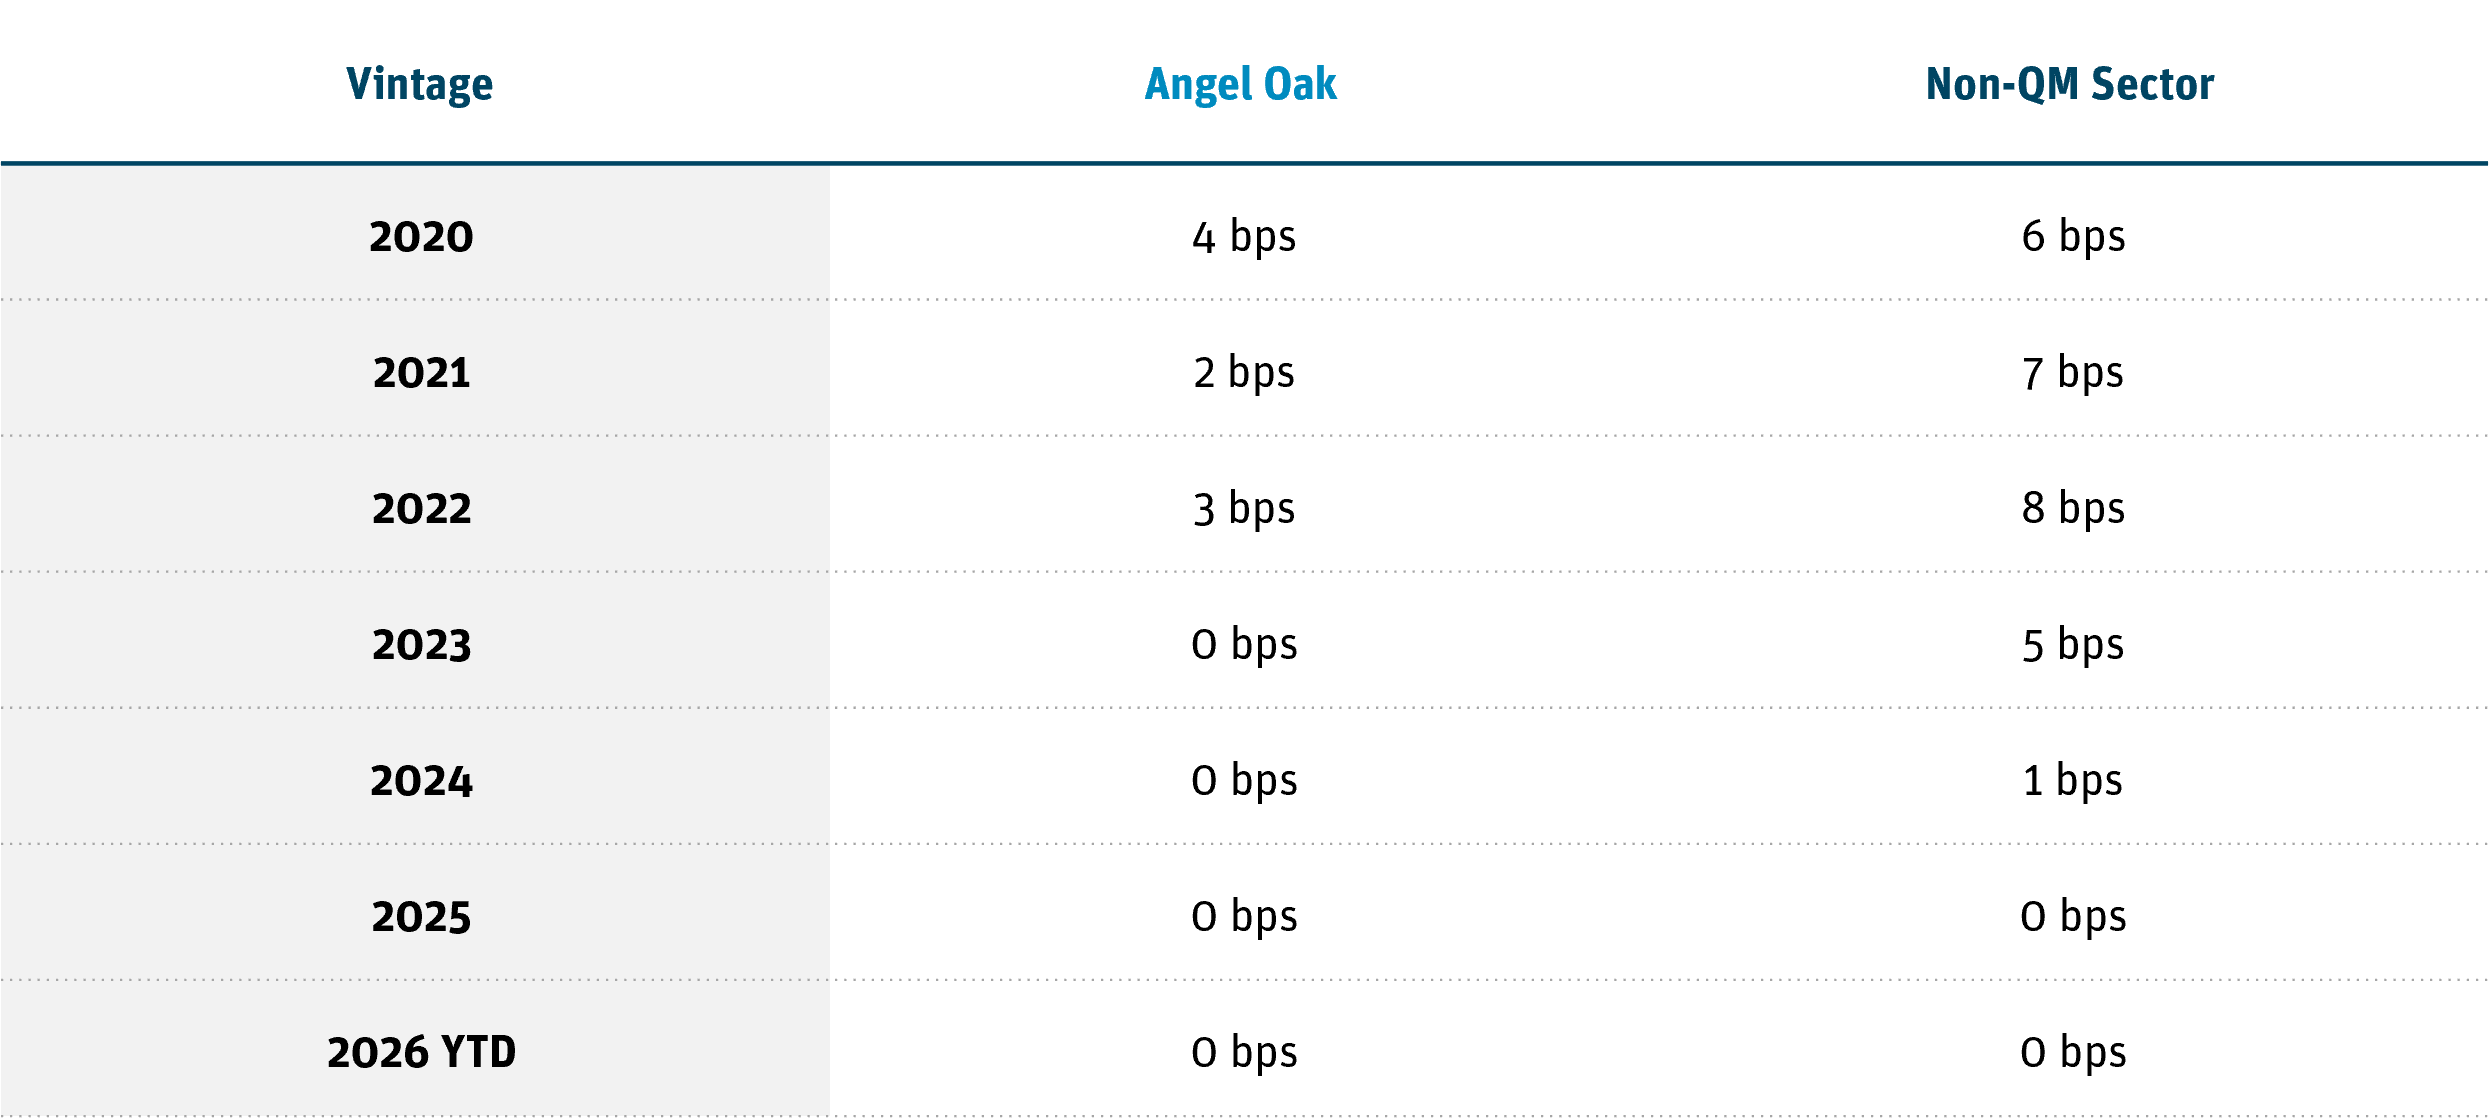
Source: BofA Global Research, Angel Oak as of June 2026.
Figure 2: Non-QM Issuance by Document Type and Vintage
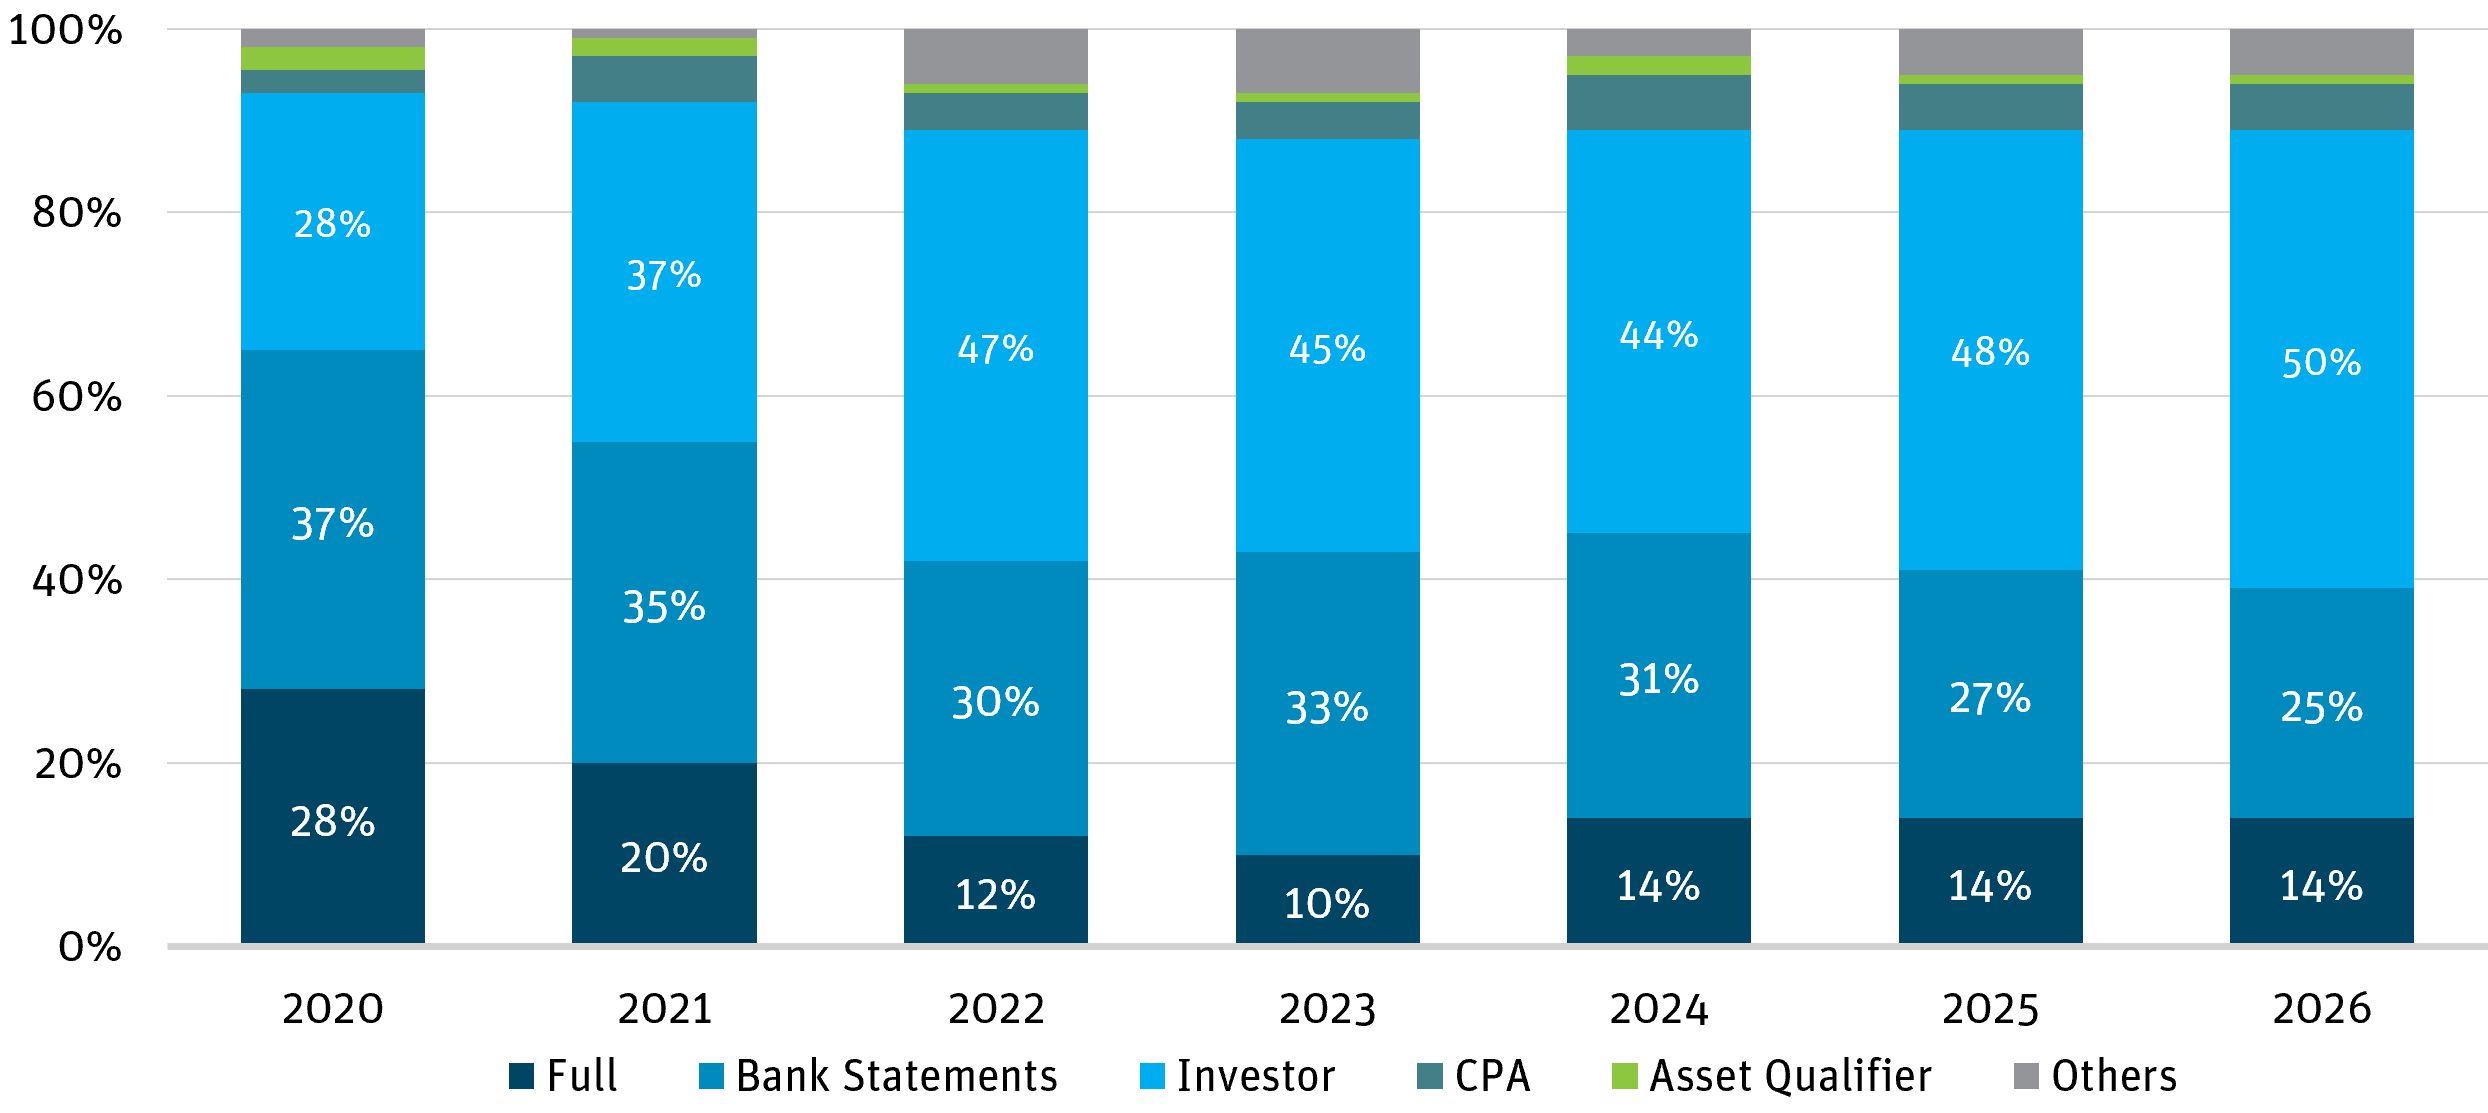
Source: BofA Global Research, Loan Performance as of June 2026.
In addition to growth in the underlying borrower segments, structural changes across the U.S. mortgage industry have also fueled expansion. Many originators that historically focused on conventional mortgages have increasingly pivoted toward Non-QM origination given the higher-rate environment and slowdown in housing transactions. The decline in conventional mortgage volumes has led the industry to view Non-QM as a core product offering rather than an ancillary business. This growing commitment is reflected both in the expanding number of originators participating in the market (Figure 3) and in industry sentiment, with 75% of mortgage brokers expecting Non-QM volumes to increase and 88% forecasting continued growth over the next 12 to 24 months, according to an A&D Mortgage survey.
Figure 3: Non-QM Originator Participation Continues to Expand
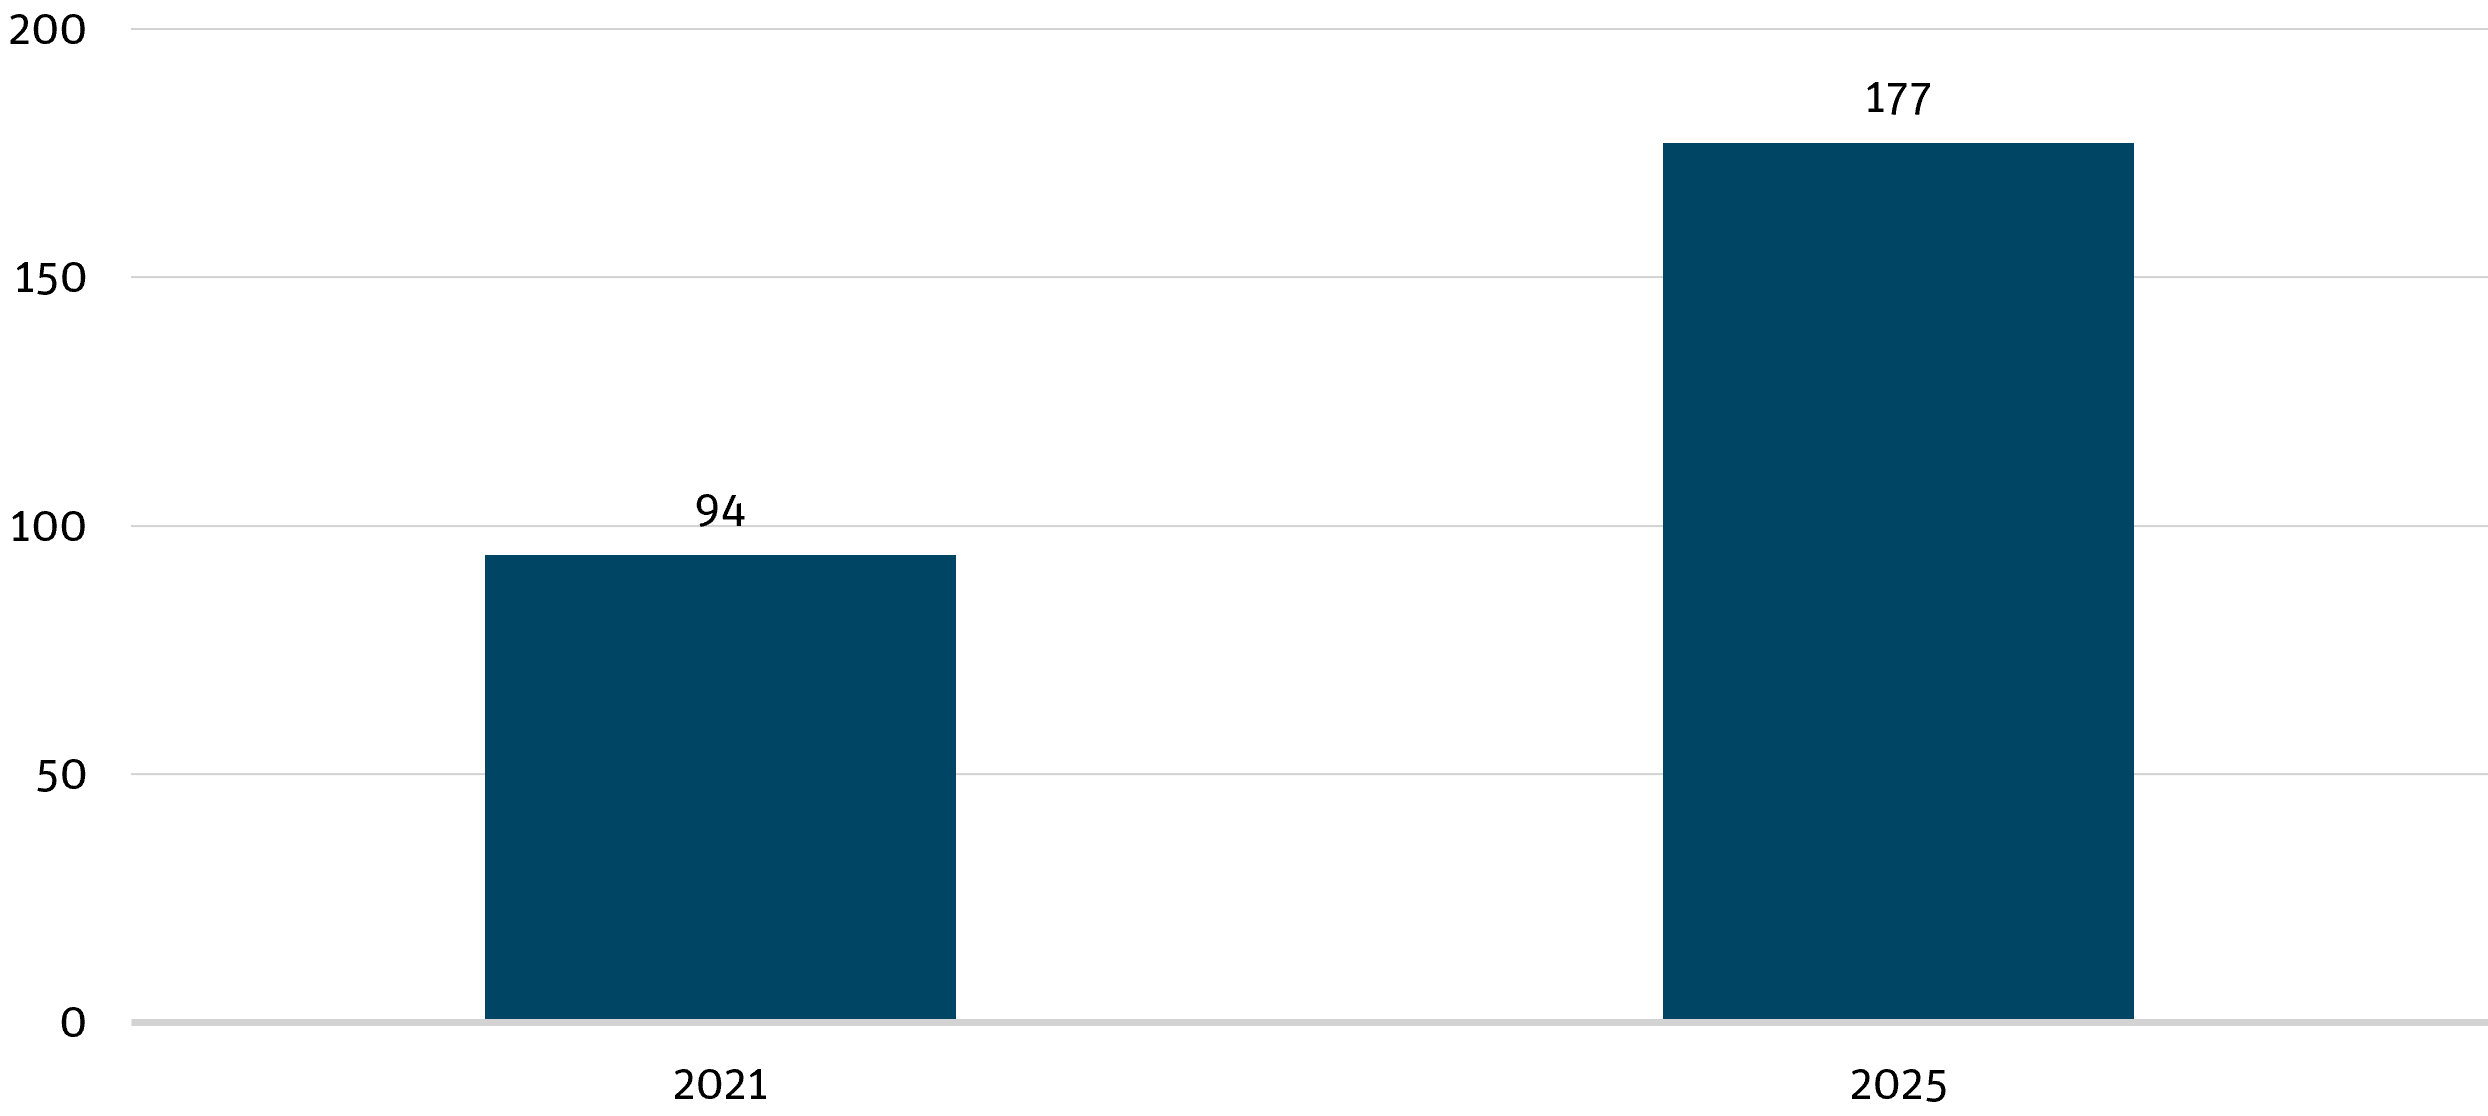
Source: BofA Global Research, Angel Oak as of June 2026.
EXAMINATION OF CREDIT PERFORMANCE
Overall, the growth in the sector has been accompanied by disciplined underwriting. Credit standards have improved, as shown in Figure 4, with the percentage of loans carrying FICO scores below 720 declining over time and the percentage of FICO scores above 760 increasing. This improvement remains significant even after accounting for post-COVID-19 “FICO inflation,” during which government stimulus supported consumer debt repayment. Additionally, layered risk, defined as the presence of multiple risk factors within a single loan that may amplify overall risk, has declined in recent years, as shown in Figure 5. Risk factors that can compound and contribute to layered risk include low FICO scores (<720), high LTV ratios (>80%), elevated debt-to-income ratios (>45%), low DSCRs for investor loans (<1.0x), and CPA/P&L-Only loans. Loans exhibiting three or more of these risk factors demonstrate a significantly higher probability of default.
Figure 4: Borrower Credit Quality Has Improved Over Time
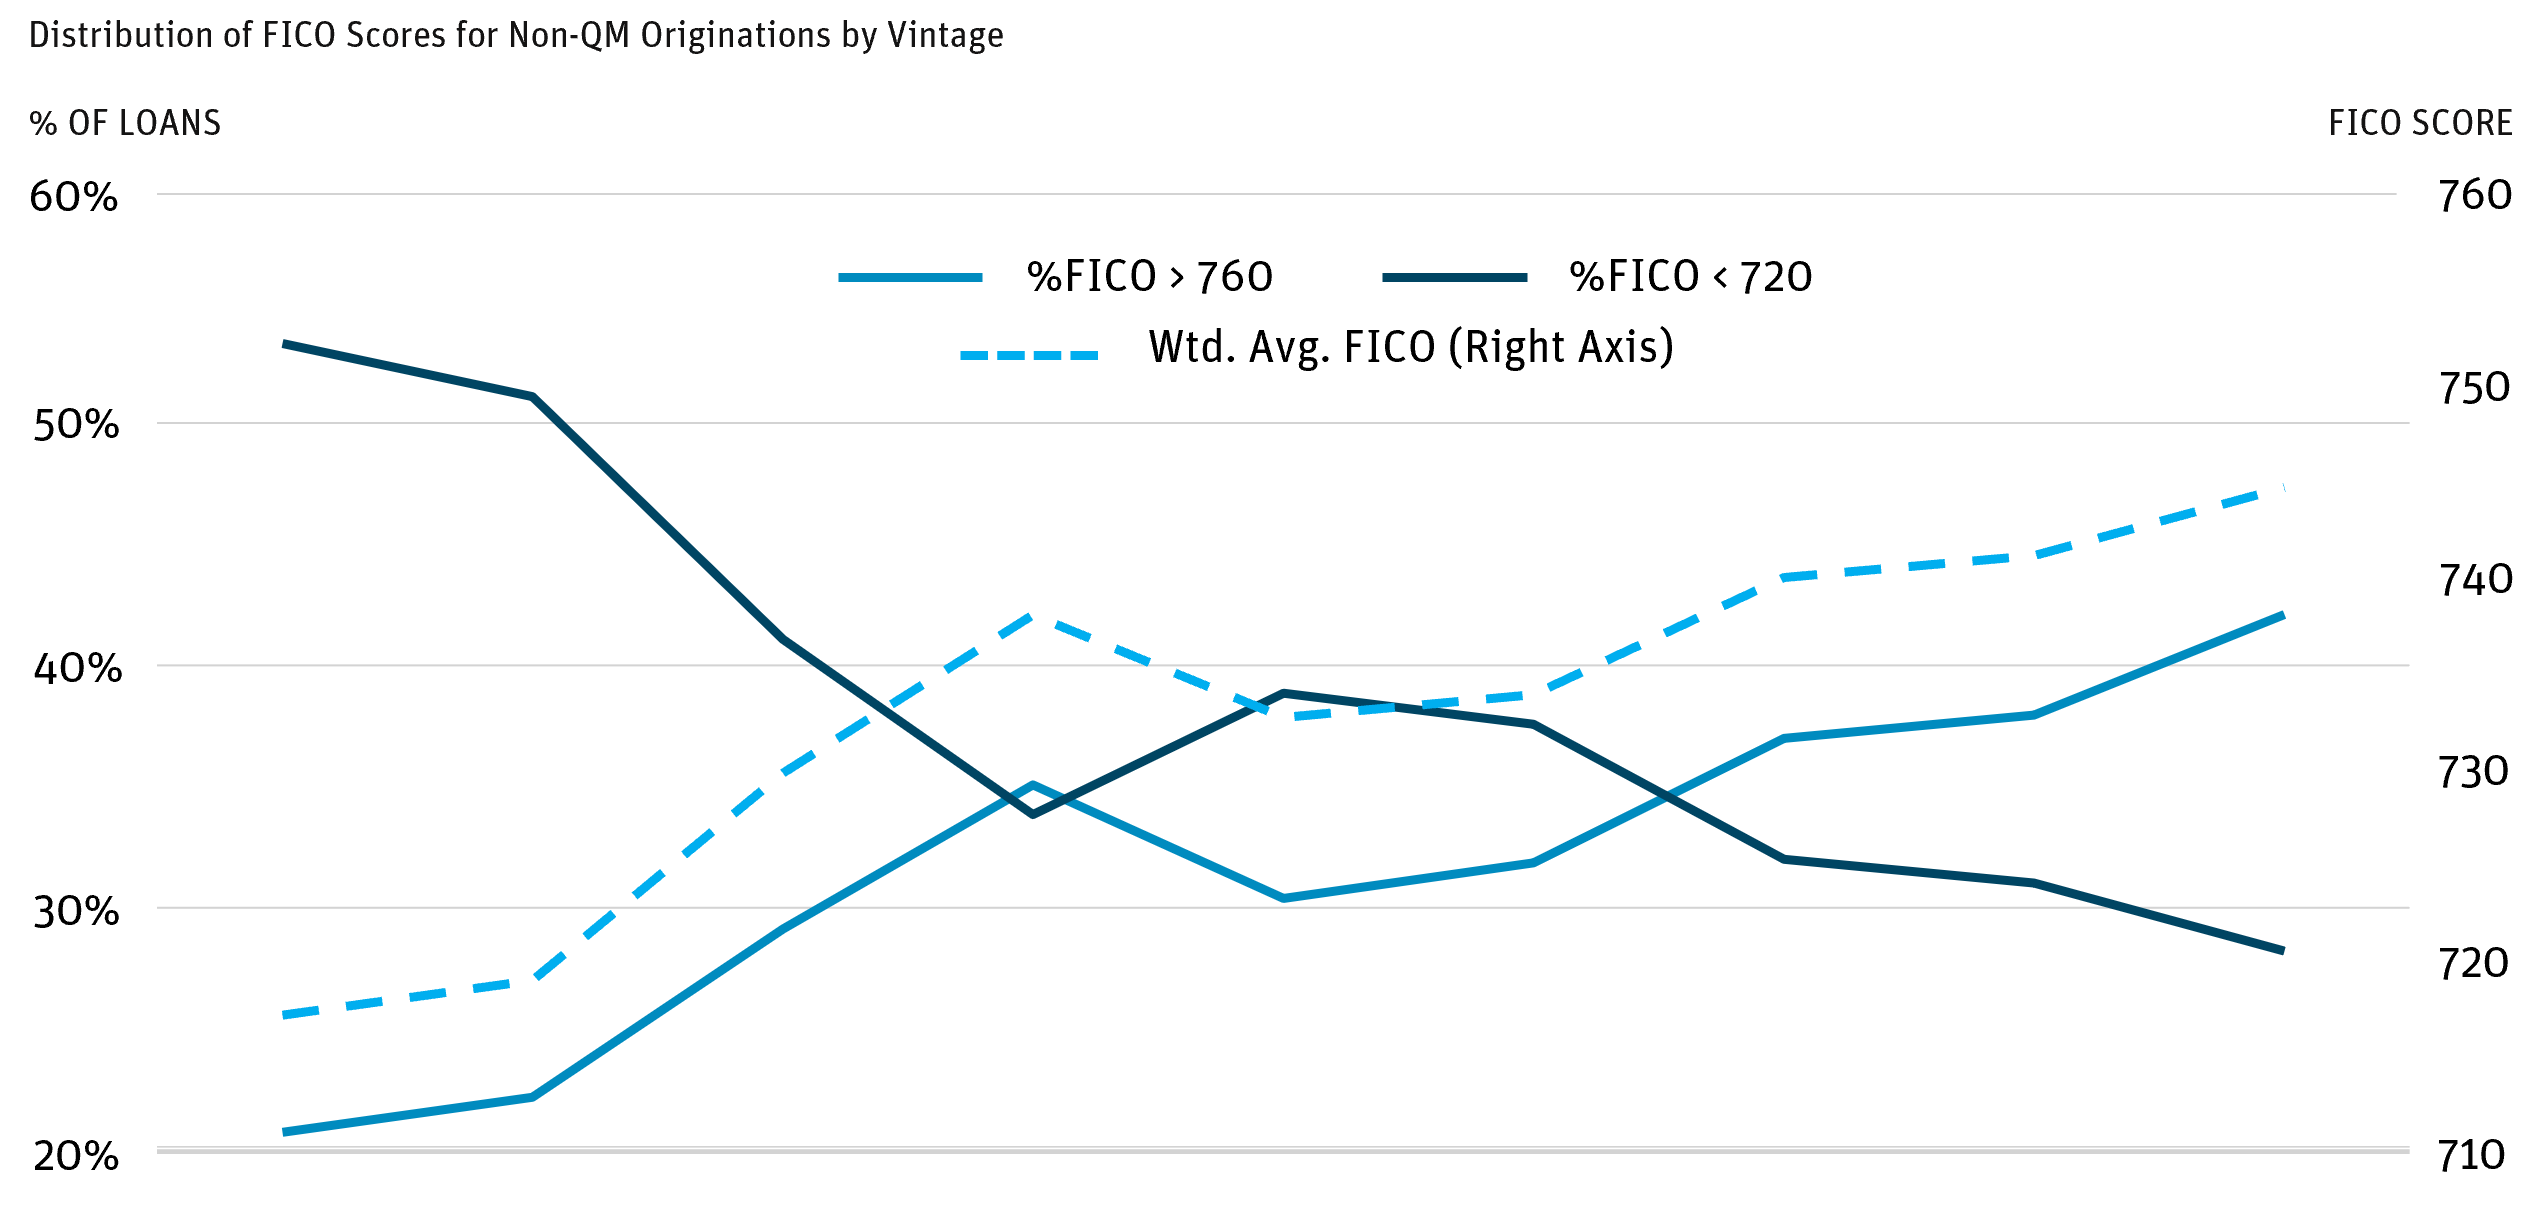
Source: BofA Global Research as of June 2026.
Figure 5: Non-QM Layered Risk by Origination Vintage Across Originators
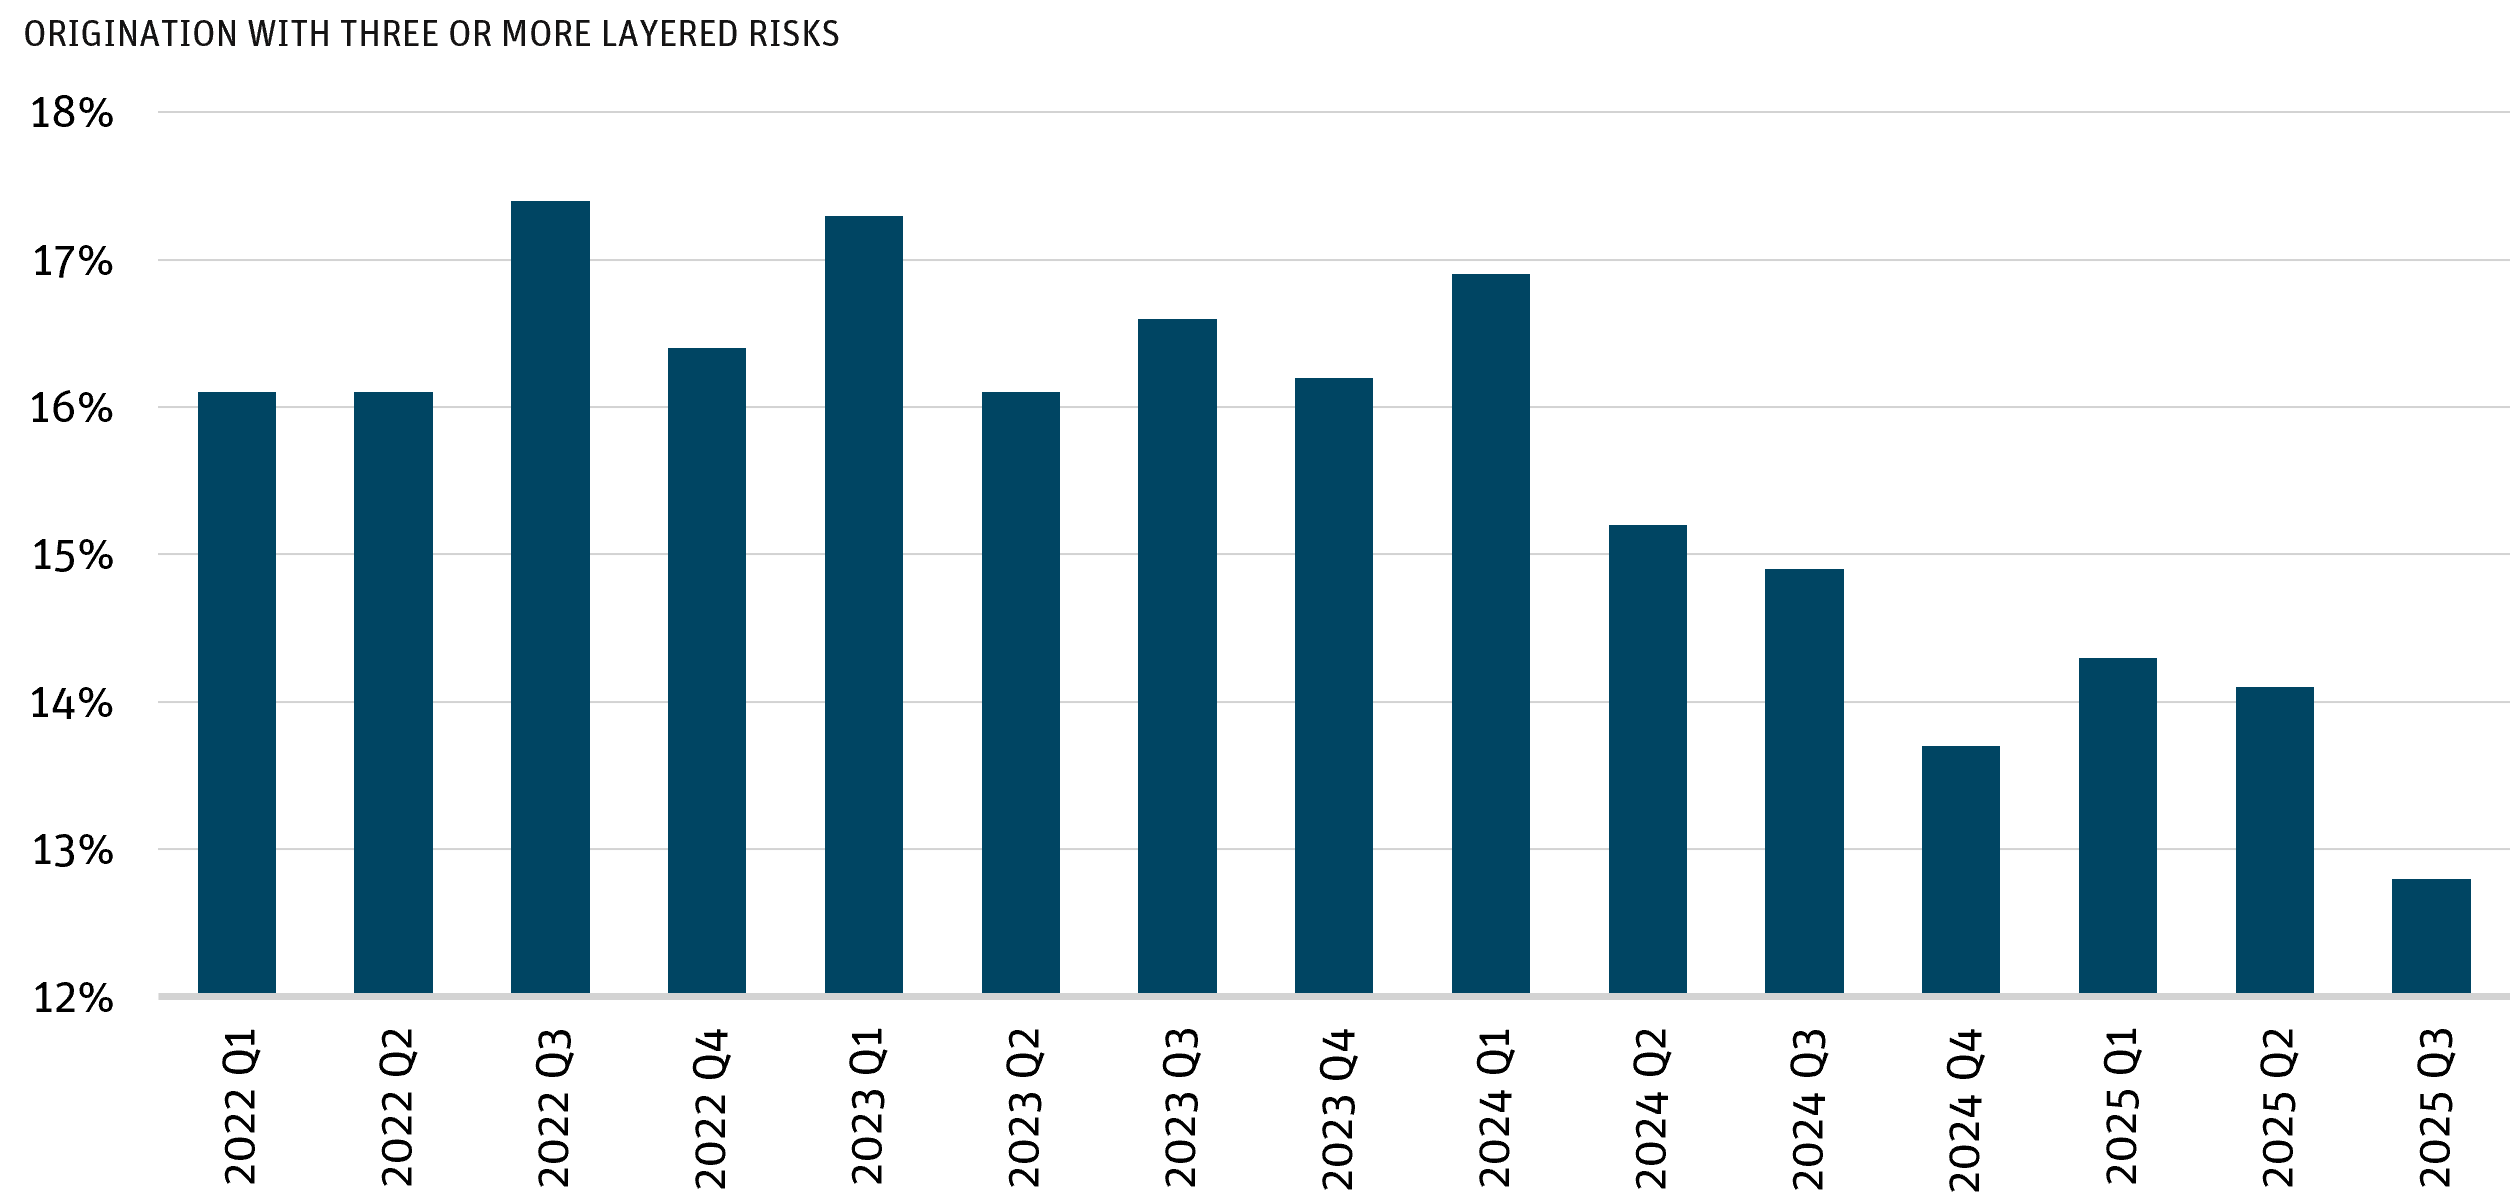
Source: Nomura as of March 2026.
However, beneath the surface, we continue to see significant performance dispersion across issuers. As the market has experienced rapid growth in origination volume and participation, the quality of underwriting and origination has become increasingly important in our view. Delinquencies across 2023 and 2024 vintages increased meaningfully compared to prior years (Figure 6). As Agency volumes declined and housing activity slowed, we believe the sector experienced an influx of newer and less experienced originators entering the Non-QM market. Experience matters, and that remains evident in recent data and performance trends.
Figure 6: Non-QM Delinquency Rates by Vintage
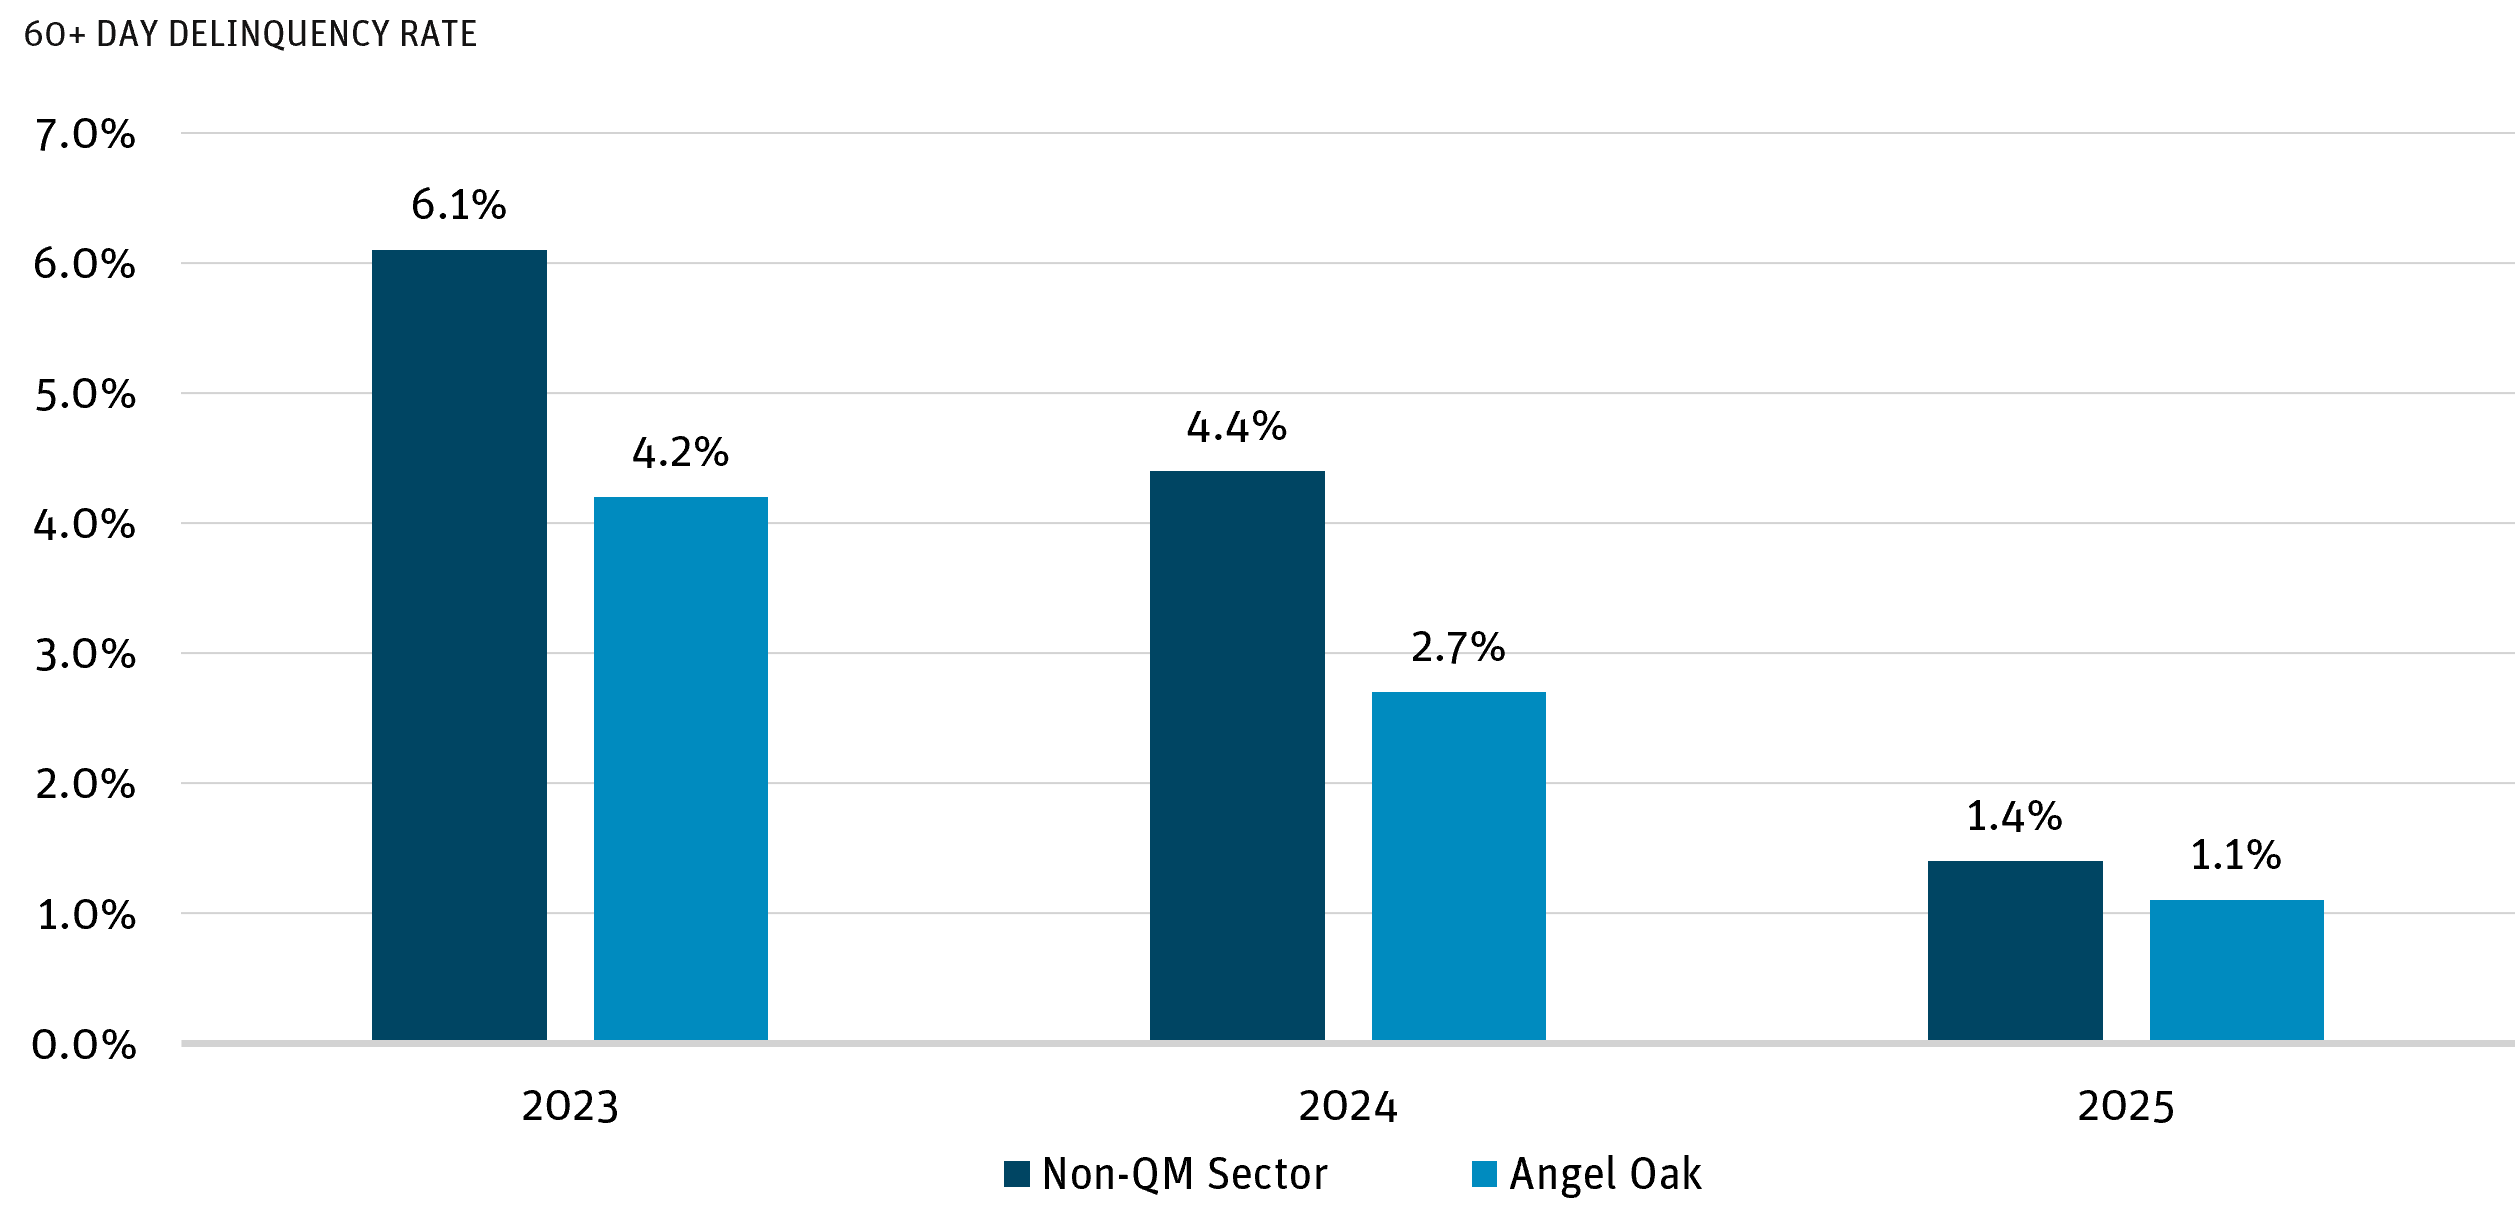
Source: J.P. Morgan as of June 2026. Non-QM Sector represents DQ rate across top 10 issuers for the respective vintage year.
For example, Nomura research on 2025 originations suggests that CPA/P&L-Only loans exhibit higher delinquency rates than Bank Statement and Investor/DSCR loans (Figure 7). These loans are underwritten without the use of bank statements for self-employed individuals and small-business owners. Another example is the variability in how originators calculate rental income and debt-service coverage for Investor/DSCR mortgages. When a property is vacant, for instance, some programs may rely on market rents rather than executed leases. Data suggests that Investor/DSCR mortgages with DSCRs below 1.0x, where rental income does not fully cover carrying costs, tend to exhibit higher delinquency rates.
At Angel Oak, our experience in the sector and our vertically integrated approach spanning origination and underwriting support a consistent investment process that has demonstrated strong credit performance over an extended period (Figure 8). While no market participant has seen every scenario, there are significant benefits to having a senior team with mortgage underwriting and origination experience dating back to the early 1990s.
Figure 7: 2025 Vintage Delinquency Ramps by Non-QM Loan Program
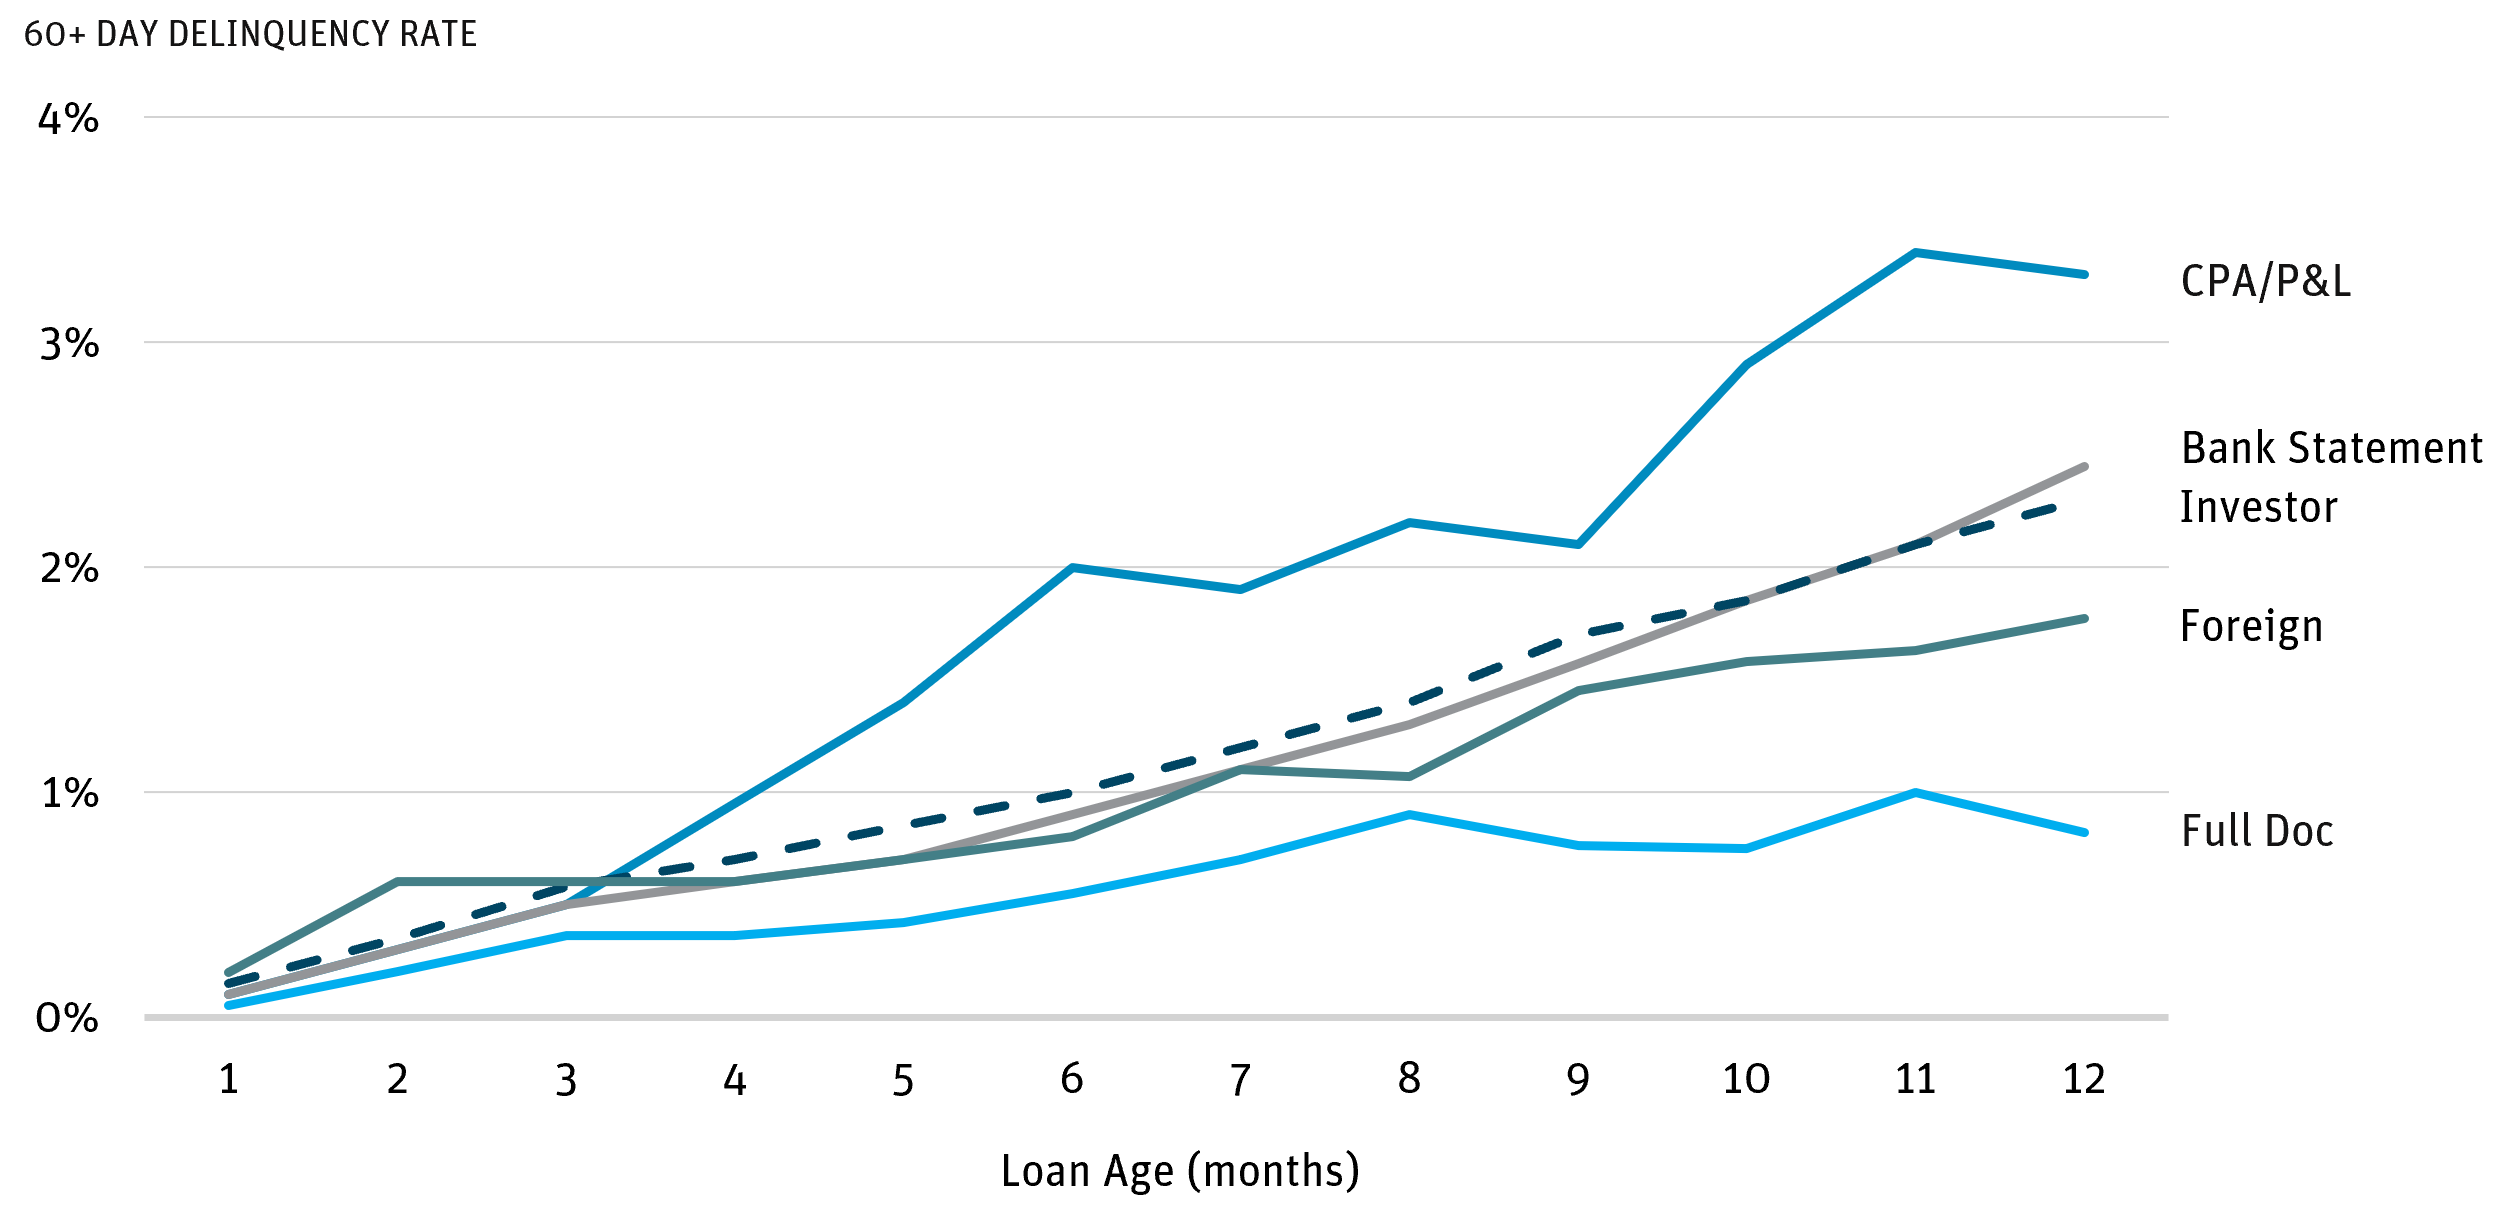
Source: Nomura, CoreLogic as of July 2026.
Figure 8: Underwriting Quality Drives Performance Outcomes
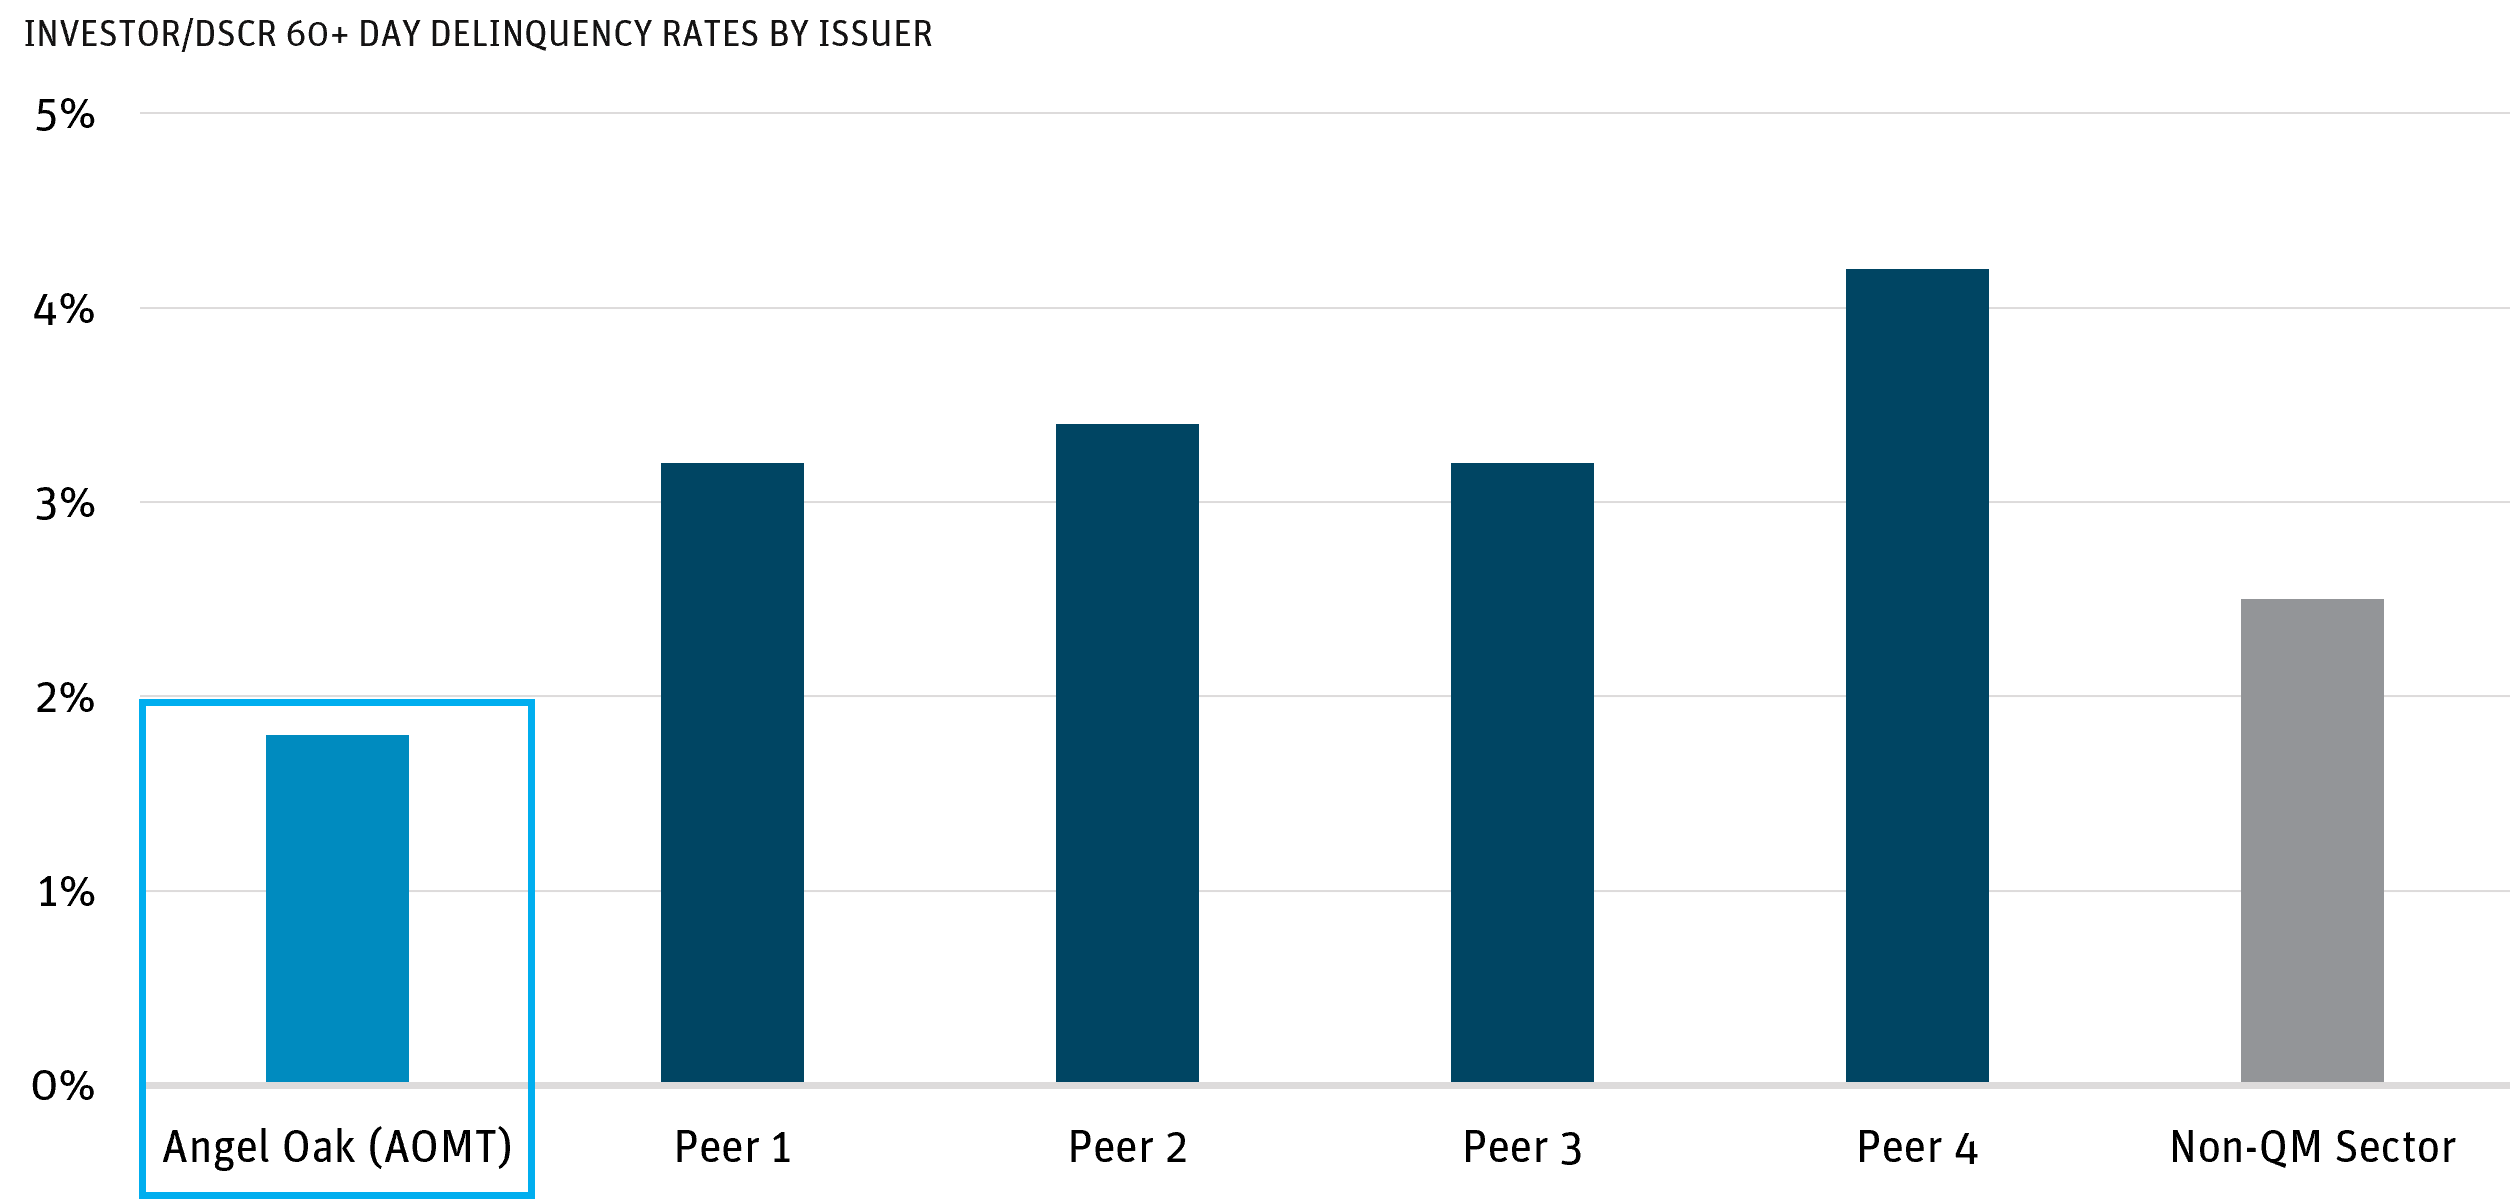
Source: J.P. Morgan as of June 2026.
INVESTOR PARTICIPATION
The Non-QM investor base has grown dramatically over the past five years into a more institutionalized ecosystem that is less sensitive to traditional risk-on/risk-off macroeconomic shifts. AAA investors view the spread pickup relative to Agency MBS and Treasuries as attractive, particularly given the structural protection provided by junior tranches against credit losses. This represents a welcome development for issuers, such as Angel Oak, that utilize securitization as a financing mechanism for underlying collateral. In our view, the yield premium relative to similarly rated Agency RMBS and investment-grade corporate bonds is driven more by market complexity and lingering investor perceptions associated with the “Non-Agency” label than by fundamental credit risk.
As the Non-QM investor base has expanded, securitization structures have evolved as well. Transactions are increasingly structured with super-senior AAA tranches and last cash flow AAA tranches designed to provide enhanced structural protection and yield pickup for risk-averse domestic investors. In addition, issuance of floating-rate senior bonds has increased to attract overseas investors, including European insurance companies and Japanese institutions.
In 2021, more than 80% of Non-QM loans were sold into the securitization market. Today’s market is considerably more balanced, with insurance companies serving as an additional outlet for whole-loan acquisitions. Insurance companies purchased $13 billion in whole loans during the first quarter of 2026, compared to $20 billion for all of 2021, according to BofA Research. Beyond whole loans, insurance companies also remain active purchasers of Non-QM senior and mezzanine tranches. Approximately 15% of Non-QM senior and mezzanine bond buyers were insurance companies in 2020. By 2026, that figure had increased to nearly 30%.
Looking ahead, we believe the market is positioned for continued growth in a responsible manner. The primary collateral backing Non-QM mortgages, single-family homes, continues to benefit from favorable supply dynamics, with 35 of the 50 largest U.S. housing markets still reporting housing shortages, according to JPM estimates. We believe Non-QM has reached an important inflection point and merits consideration as a strategic allocation for investors seeking attractive risk-adjusted returns within real estate debt and asset-backed finance portfolios.
DISCLOSURES
The views expressed represent the opinion of Angel Oak Capital Advisors which are subject to change and are not intended as a forecast or guarantee of future results. Stated information is derived from proprietary and non-proprietary sources which have not been independently verified for accuracy or completeness. While Angel Oak Capital Advisors believes the information to be accurate and reliable, we do not claim or have responsibility for its completeness, accuracy, or reliability. Statements of future expectations, estimates, projections, and other forward-looking statements are based on available information and management’s view as of the time of these statements. Accordingly, such statements are inherently speculative as they are based on assumptions that may involve known and unknown risks and uncertainties. Actual results, performance, or events may differ materially from those expressed or implied in such statements.
All investing involves risk, including the loss of principal. There is no guarantee that investment objectives will be attained. Results may vary. There is no guarantee that risk can be managed successfully.
This document does not constitute advice or a recommendation or offer to sell or a solicitation to deal in any security or financial product. It is provided for informational purposes only and on the understanding that the recipient has sufficient knowledge and experience to be able to understand and make their own evaluation of the proposals and services described herein, any risks associated therewith, and any related legal, tax, accounting, or other material considerations. To the extent that the reader has any questions regarding the applicability of any specific issue discussed above to their specific portfolio or situation, prospective investors are encouraged to contact Angel Oak Capital Advisors or consult with the professional advisor of their choosing.
Except where otherwise indicated, the information contained in this presentation is based on matters as they exist as of the date of preparation of such material and not as of the date of distribution or any future date. Recipients should not rely solely on this material in making any future investment decision.
This presentation is confidential and is intended only for the person to whom it has been directly provided, and under no circumstances may a copy be shown, copied, transmitted, or otherwise be given to any person other than the authorized recipient without the prior written consent of Angel Oak Capital Advisors.
Past performance is no guarantee of future returns. No guarantee of investment performance is being provided, and no inference to the contrary should be made.
Angel Oak Capital Advisors is a registered investment advisor. However, registration as an investment advisor with the SEC does not imply approval by the SEC or that the advisor or its employees possess a certain level of skill or training.