Heading into 2025, signs of strength have emerged in the banking sector, which is well positioned to turn from defense to offense. Eager to leave 2023 behind after three of the largest bank failures in U.S. history, the sector got a volatile start to 2024; bank stocks staged a sharp midyear rally, but a year-end swoon required banks to give back much of their post-Election Day bounce. The NASDAQ OMX ABA Community Bank Index (QABA) ended 2024 up 15.24%, while the larger KBW Regional Banking Index (KRX) returned 13.20%. Each index’s solid returns tracked the Russell 2000 11.54% but lagged the S&P 500’s 25.02% return significantly.
Figure 1:
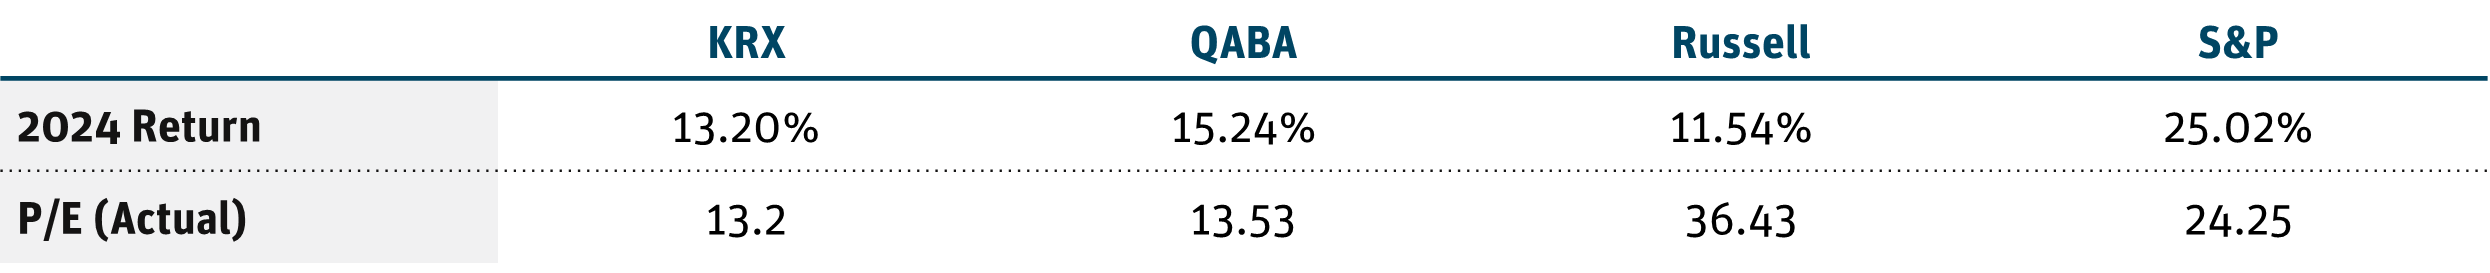
Source: Bloomberg as of 12/31/24.
At current discounted levels, however, we believe bank stocks stand to benefit from three unique, interconnected tailwinds: (1) a steeper yield curve, (2) stable-to-improving credit quality and (3) historically low valuations. More favorable rate positioning should enable banks to maintain strong credit quality and compress the wide valuation discount relative to the broader market. Simply put, bank stocks are too cheap – which represents a rare opportunity to invest in a sector that hasn’t fully participated in the broader market’s multiyear rally.
Rates: Margins Appear to Have Found Bottom as Curve Slopes Upward
The pace and magnitude of the Federal Reserve’s rate increase campaign was painful for banks’ net interest margins (NIMs). On top of that, the spring 2023 crisis (triggered by Silicon Valley Bank’s March failure) caused many regional banks to turn inward and raise liquidity at punitive rates. These days, however, margins are already signaling a bottom: After six consecutive quarters of margin compression, NIMs were actually up 5 basis points (bps) for the banking sector in the third quarter of 2024. This reversal impacts not just earnings growth but book values, which are recovering from 10%-20% average declines during the Fed’s rate hike cycle, thanks to improved pricing on banks’ investment portfolios.
Given that banks tend to fund themselves at the short end and lend at the long end, the yield curve’s slope is a primary determinant in projecting forward margins. So, in addition to its reputation for foretelling a recession, an inverted yield curve can put a lid on earnings growth. Following 564 days of an inverted 2/10 year yield curve – the longest inversion in nearly 50 years – that spread turned positive in September 2024 and is now at the highest level since May 2022, when bank margins peaked (Figure 2).
We expect the macro environment to benefit banks, and our highest convictions are focused on funding costs repricing at a faster rate to the downside than asset yields – which would fuel a transformative self-help narrative specific to the banking sector.
Figure 2: U.S. 2s 10s Yield Curve
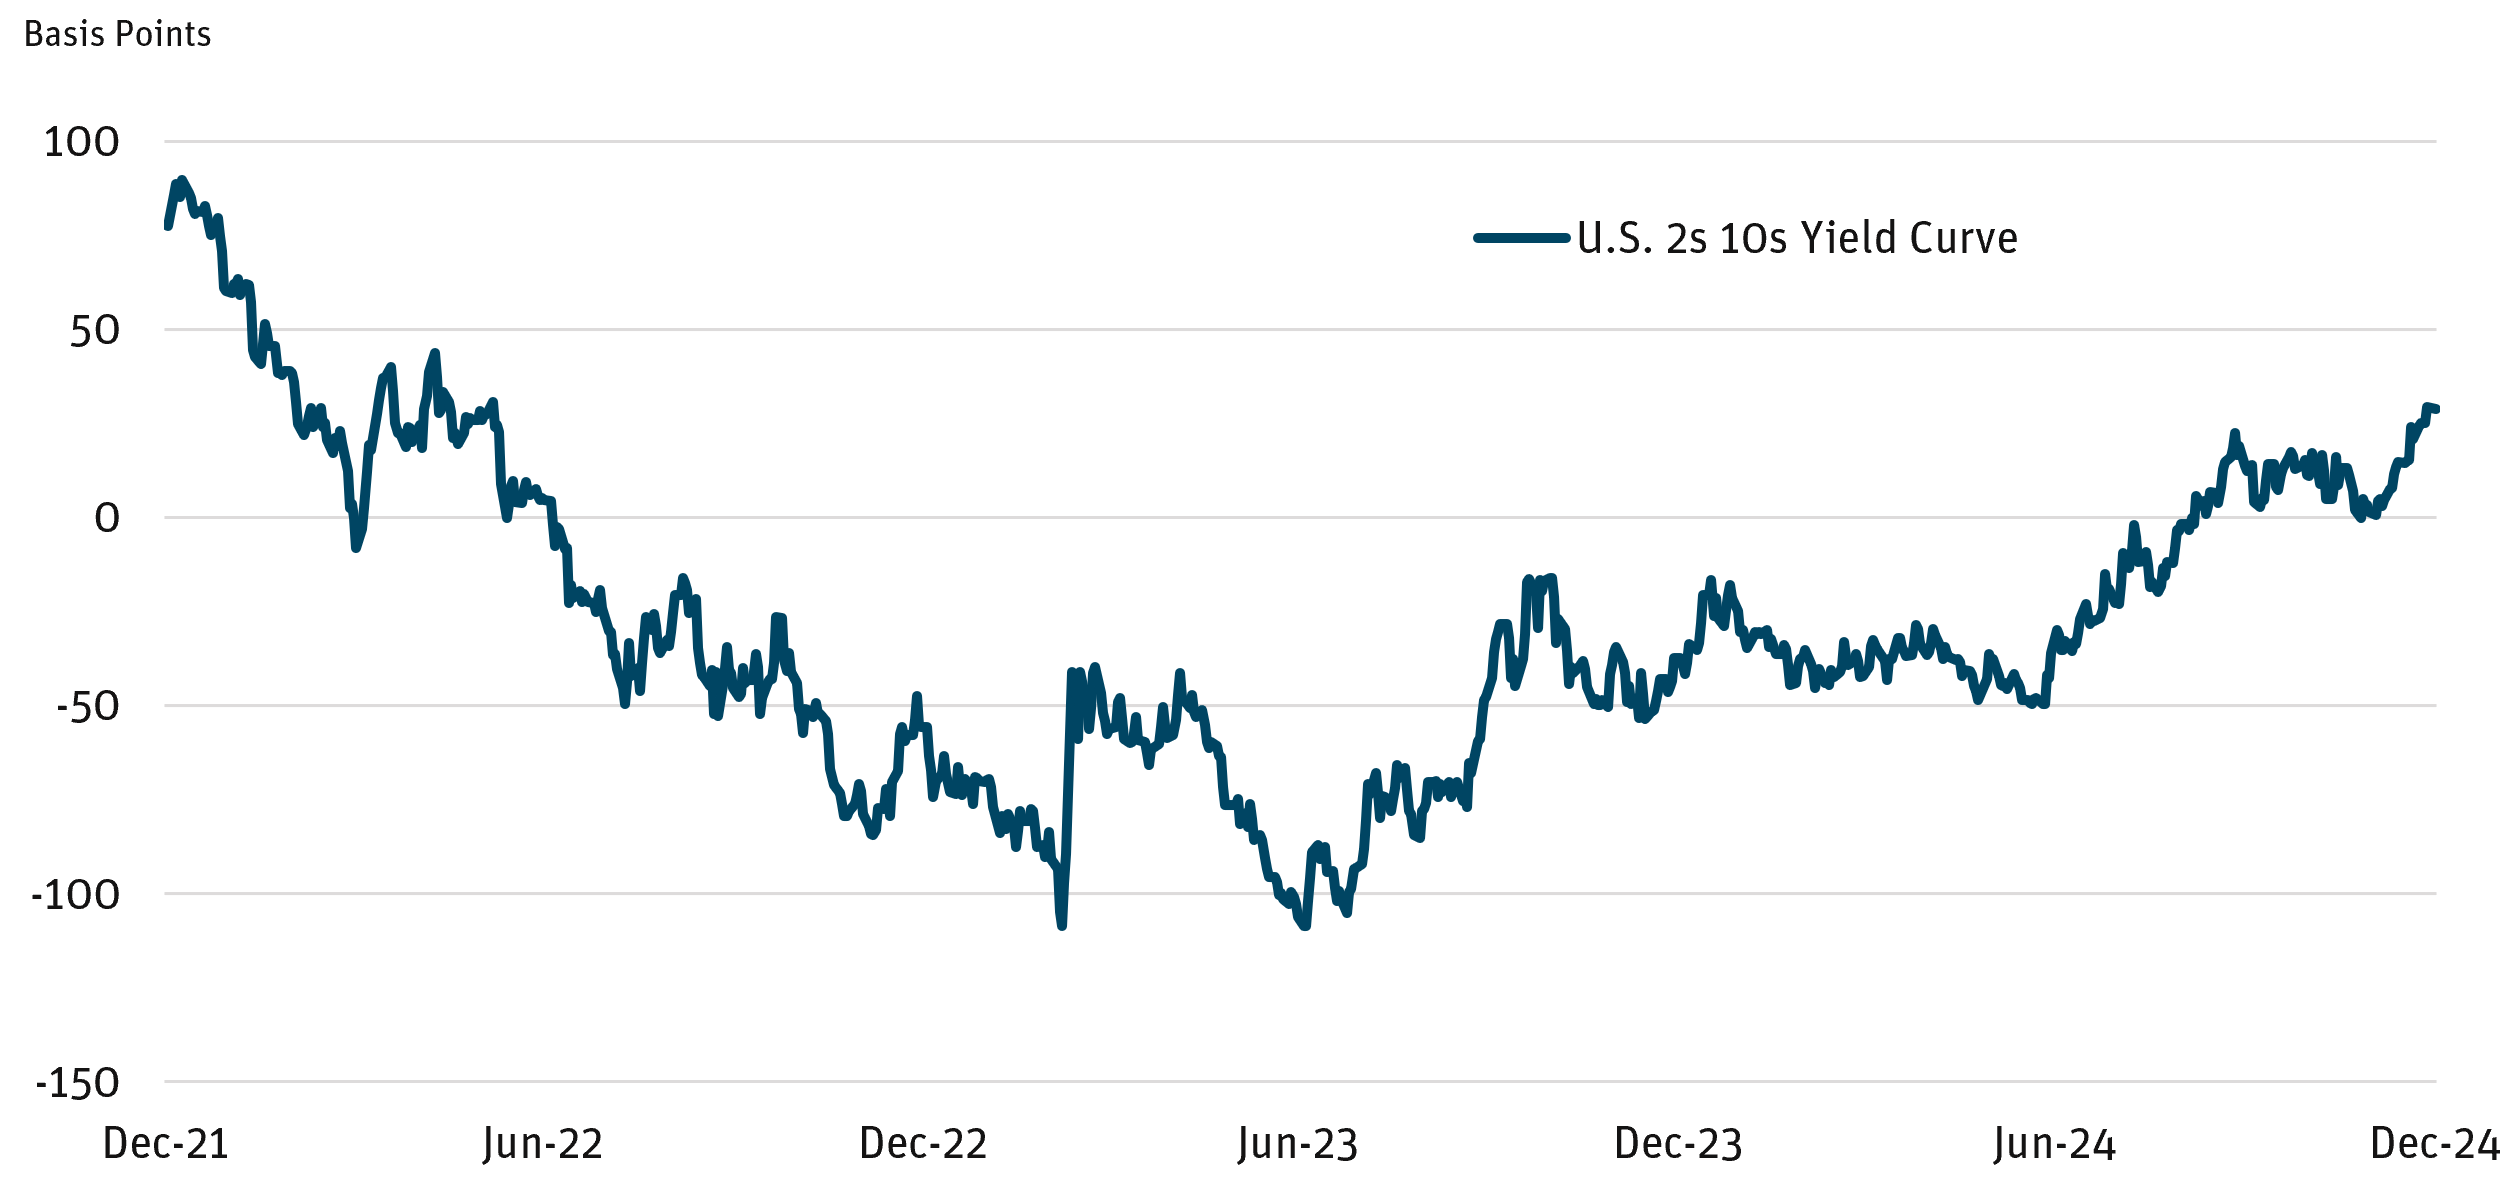
Source: Bloomberg as of 12/31/24.
Credit: Idiosyncratic Issues Cloud an Otherwise Positive Backdrop
In March 2024, we wrote about the credit troubles at New York Community Bancorp (renamed Flagstar Financial), signaling that its “troubles are somewhat unique, given an aggressive acquisition history and an idiosyncratic loan portfolio.” At the time, investor sentiment toward regional banks was decidedly negative, and most market observers were waiting for the shoe to drop regarding asset quality. With regional banks trading at multi-decade lows, we highlighted the relative strength of banks’ loan loss reserves and capital ratios. From mid-March 2024 through year end, regional bank stocks saw a total return of nearly 25%, outpacing the S&P’s approximate 16% return for the same period.
Our view of credit quality mirrors that earlier report, and on the equity side, we established and maintained an overweight position in certain commercial real estate (CRE) focused banks, particularly strong underwriters with superior long-term track records. Credit losses remain manageable for the industry as a whole, and loan loss reserves are sitting at 1.71%, exceeding the 20-plus-year average of 1.53%. Although certain asset classes remain challenged – especially in CRE – public banks have responded to investor demand with increased reporting transparency, offering in-depth detail on potential problem exposures.
As we move into the new year, the CRE market is strengthening, boosted by rebounding capital markets (i.e., origination volumes) in 2024 and office leasing that has been tracking at a double-digit annual increase.
With the secured overnight financing rate closing the year at 4.30%, down more than 100 bps from a June 2024 peak, we expect lower rates to benefit banks and their borrowers, allowing for more palatable refinancing rates. This is especially salient as several banks we follow have prudently managed their loan maturity profiles, suggesting a majority of CRE loans coming due in 2027 or beyond. Flagstar, for example, reported in the second quarter of 2024 that more than $2 billion of its rent-regulated multifamily portfolio had repriced from 3.85% to 8.19% over the previous 18 months, helping offset the $725 million in loans that were paid off. Presumably, those loans refinanced at competitive rates elsewhere, boosting margins all around.
Valuation: Rates, Credit Should Catalyze Valuation Expansion
For the past 15 years, regional banks’ relative P/E to the S&P 500 has averaged 90%. That gap has widened over the previous two years, and banks at the end of 2024 were trading at 55% of the S&P’s valuation level. Improving fundamentals (i.e., moderate loan growth, stable credit) and a clearer macro picture (i.e., lower inflation, a positive sloping yield curve) should translate to meaningful valuation expansion, regardless of broader market movements.
Figure 3: Relative P/E
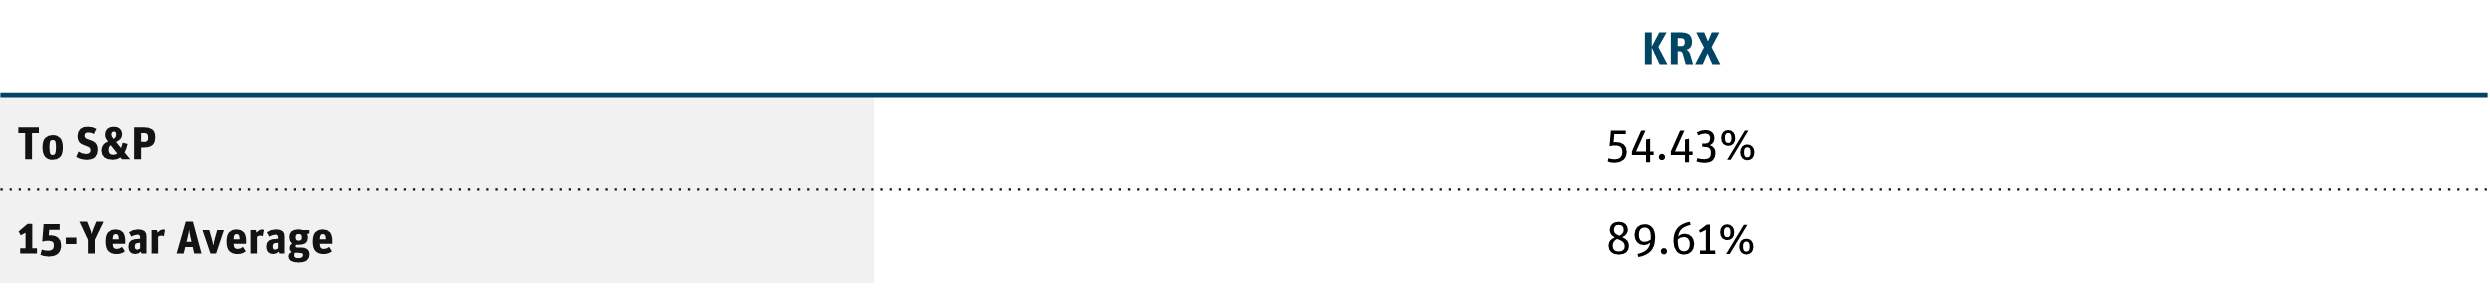
Source: Bloomberg as of 12/31/24.
Even though financials are the second-largest sector weight in both the S&P and Russell, banks in general are under-owned by the institutional investor community. During the mini-crisis in 2023, bank stocks fell by approximately 40%, the second-largest drawdown (after COVID-19) since the global financial crisis of 2007-08. Since the May 2023 bottom, however, bank stocks have increased just over 58%, compared with the median recovery (in previous 40%+ drawdown periods) of 99%. History doesn’t always repeat itself, but bank stocks tend to overcorrect in both directions, and the theme of 2025 could be a widespread catch-up for regional and community bank stocks.
DEFINITIONS AND DISCLOSURES
KBW Regional Banking Index (KRX): The index seeks to reflect the performance of U.S. companies that do business as regional banks or thrifts.
NASDAQ OMX ABA Community Bank Index (QABA): A market capitalization weighted index designed to track the performance of banks and thrifts, or their holding companies, listed on The NASDAQ Stock Market.
Net Interest Margin (NIM): An industry-specific profitability ratio for banks and other financial institutions. It is a measure of the spread a bank earns between interest income and the amount of interest paid out to its depositors, expressed as a percentage of earning assets.
Price/Earnings (P/E) Ratio: The ratio of a company’s stock price to the company’s earnings per share.
Russell 2000 Index: A stock market index that measures the performance of the 2,000 smaller companies included in the Russell 3000 Index.
S&P 500 Total Return Index (SPX): The index is widely regarded as the best single gauge of large-cap U.S. equities and serves as the foundation for a wide range of investment products. The index includes 500 leading companies and captures approximately 80% coverage of available market capitalization.
Secured Overnight Financing Rate (SOFR): A fully-transaction based, nearly risk- free reference rate and is a broad measure of the cost of borrowing cash overnight collateralized by U.S. Treasury securities. SOFR covers the most volume of transactions of any rate based on the U.S. Treasury repurchase agreement (repo) market and reflects the economic cost of lending and borrowing by the wide array of market participants active in the repo market.
Yield Curve: The U.S. Treasury yield curve refers to a line chart that depicts the yields of short-term Treasury bills compared to the yields of long-term Treasury notes and bonds. The slope, shape, and level of yield curves may vary over time with changes in interest rates.
It is not possible to invest directly in an index.
Must be preceded or accompanied by a prospectus. To obtain an electronic copy of the prospectus, please visit www.angeloakcapital.com.
Opinions expressed are as of 12/31/24 and are subject to change at any time, are not guaranteed, and should not be considered investment advice.
Investing involves risk; principal loss is possible. Investments in debt securities typically decrease when interest rates rise. This risk is usually greater for longer- term debt securities. Investments in lower-rated and nonrated securities present a greater risk of loss to principal and interest than do higher-rated securities. Investments in asset-backed and mortgage-backed securities include additional risks that investors should be aware of, including credit risk, prepayment risk, possible illiquidity and default, as well as increased susceptibility to adverse economic developments. Derivatives involve risks different from — and in certain cases, greater than — the risks presented by more traditional investments. Derivatives may involve certain costs and risks such as illiquidity, interest rate, market, credit, management and the risk that a position could not be closed when most advantageous. Investing in derivatives could lead to losses that are greater than the amount invested. The Fund may make short sales of securities, which involves the risk that losses may exceed the original amount invested. The Fund may use leverage, which may exaggerate the effect of any increase or decrease in the value of securities in the Fund’s portfolio or the Fund’s net asset value, and therefore may increase the volatility of the Fund. Investments in foreign securities involve greater volatility and political, economic and currency risks and differences in accounting methods. These risks are increased for emerging markets. Investments in fixed-income instruments typically decrease in value when interest rates rise. The Fund will incur higher and duplicative costs when it invests in mutual funds, ETFs and other investment companies. There is also the risk that the Fund may suffer losses due to the investment practices of the underlying funds. For more information on these risks and other risks of the Fund, please see the Prospectus.
Index performance is not indicative of Fund performance. Past performance does not guarantee future results. Current performance can be obtained by calling 855-751-4324.
As of 12/31/24, no securities mentioned were held by the Angel Oak Funds.
The Angel Oak Funds are distributed by Quasar Distributors, LLC.
© 2024 Angel Oak Capital Advisors, which is the adviser to the Angel Oak Funds.