OVERVIEW
This piece explores why Core-Plus strategies have historically delivered superior results and examines the key drivers of that outperformance—factors that underpin Angel Oak’s expertise—including credit selection, identifying value across fixed-income sectors, and harvesting off-benchmark premiums. It also defines the Core-Plus category, explains its relationship to the Bloomberg U.S. Aggregate Bond Index (Agg), and outlines the essential elements of an investment approach designed to achieve outperformance.
MORNINGSTAR’S CORE-PLUS BOND CATEGORY
Morningstar established the Intermediate Core-Plus Bond category in 2019¹ and defined it as “intermediate-term core-plus bond portfolios [that] invest primarily in investment-grade (IG) U.S. fixed-income issues, including government, corporate, and securitized debt. They generally have greater flexibility than core offerings to hold non-core sectors, such as corporate high yield, bank loans, emerging-market debt, and non-U.S. currency exposures. Their durations (a measure of interest-rate sensitivity) typically range between 75% and 125% of the three-year average of the effective duration of the Morningstar U.S. Core Bond Index.”²
These strategies are important because, as the name suggests, they typically form the core of a client’s fixed-income allocation. Their goal is to outperform the Agg by overweighting or underweighting index sectors and incorporating non-core, below-IG assets such as corporate high-yield (HY) bonds, bank loans, and emerging-market debt. They may also include securitized credit sectors such as non-agency residential mortgage-backed securities (RMBS), asset-backed securities (ABS), or collateralized loan obligations (CLOs), which can offer a premium to corporate credit.³
Given current spreads, Angel Oak’s bias is to overweight securitized credit in a Core-Plus portfolio, which often represents the largest fixed-income allocation across our strategies.
Core-Plus strategies have tended to outperform their Core Bond benchmark. Since the category’s inception in 2019, which included volatile periods such as the COVID-19 pandemic beginning in 2020 and the 2022 bond bear market, the Agg has delivered an annualized total return of 1.5%, underperforming the Core-Plus category, which has delivered 2.68% gross/1.99% net of fees⁴ (see Figure 1).
Figure 1: Performance From May 2019 to September 2025
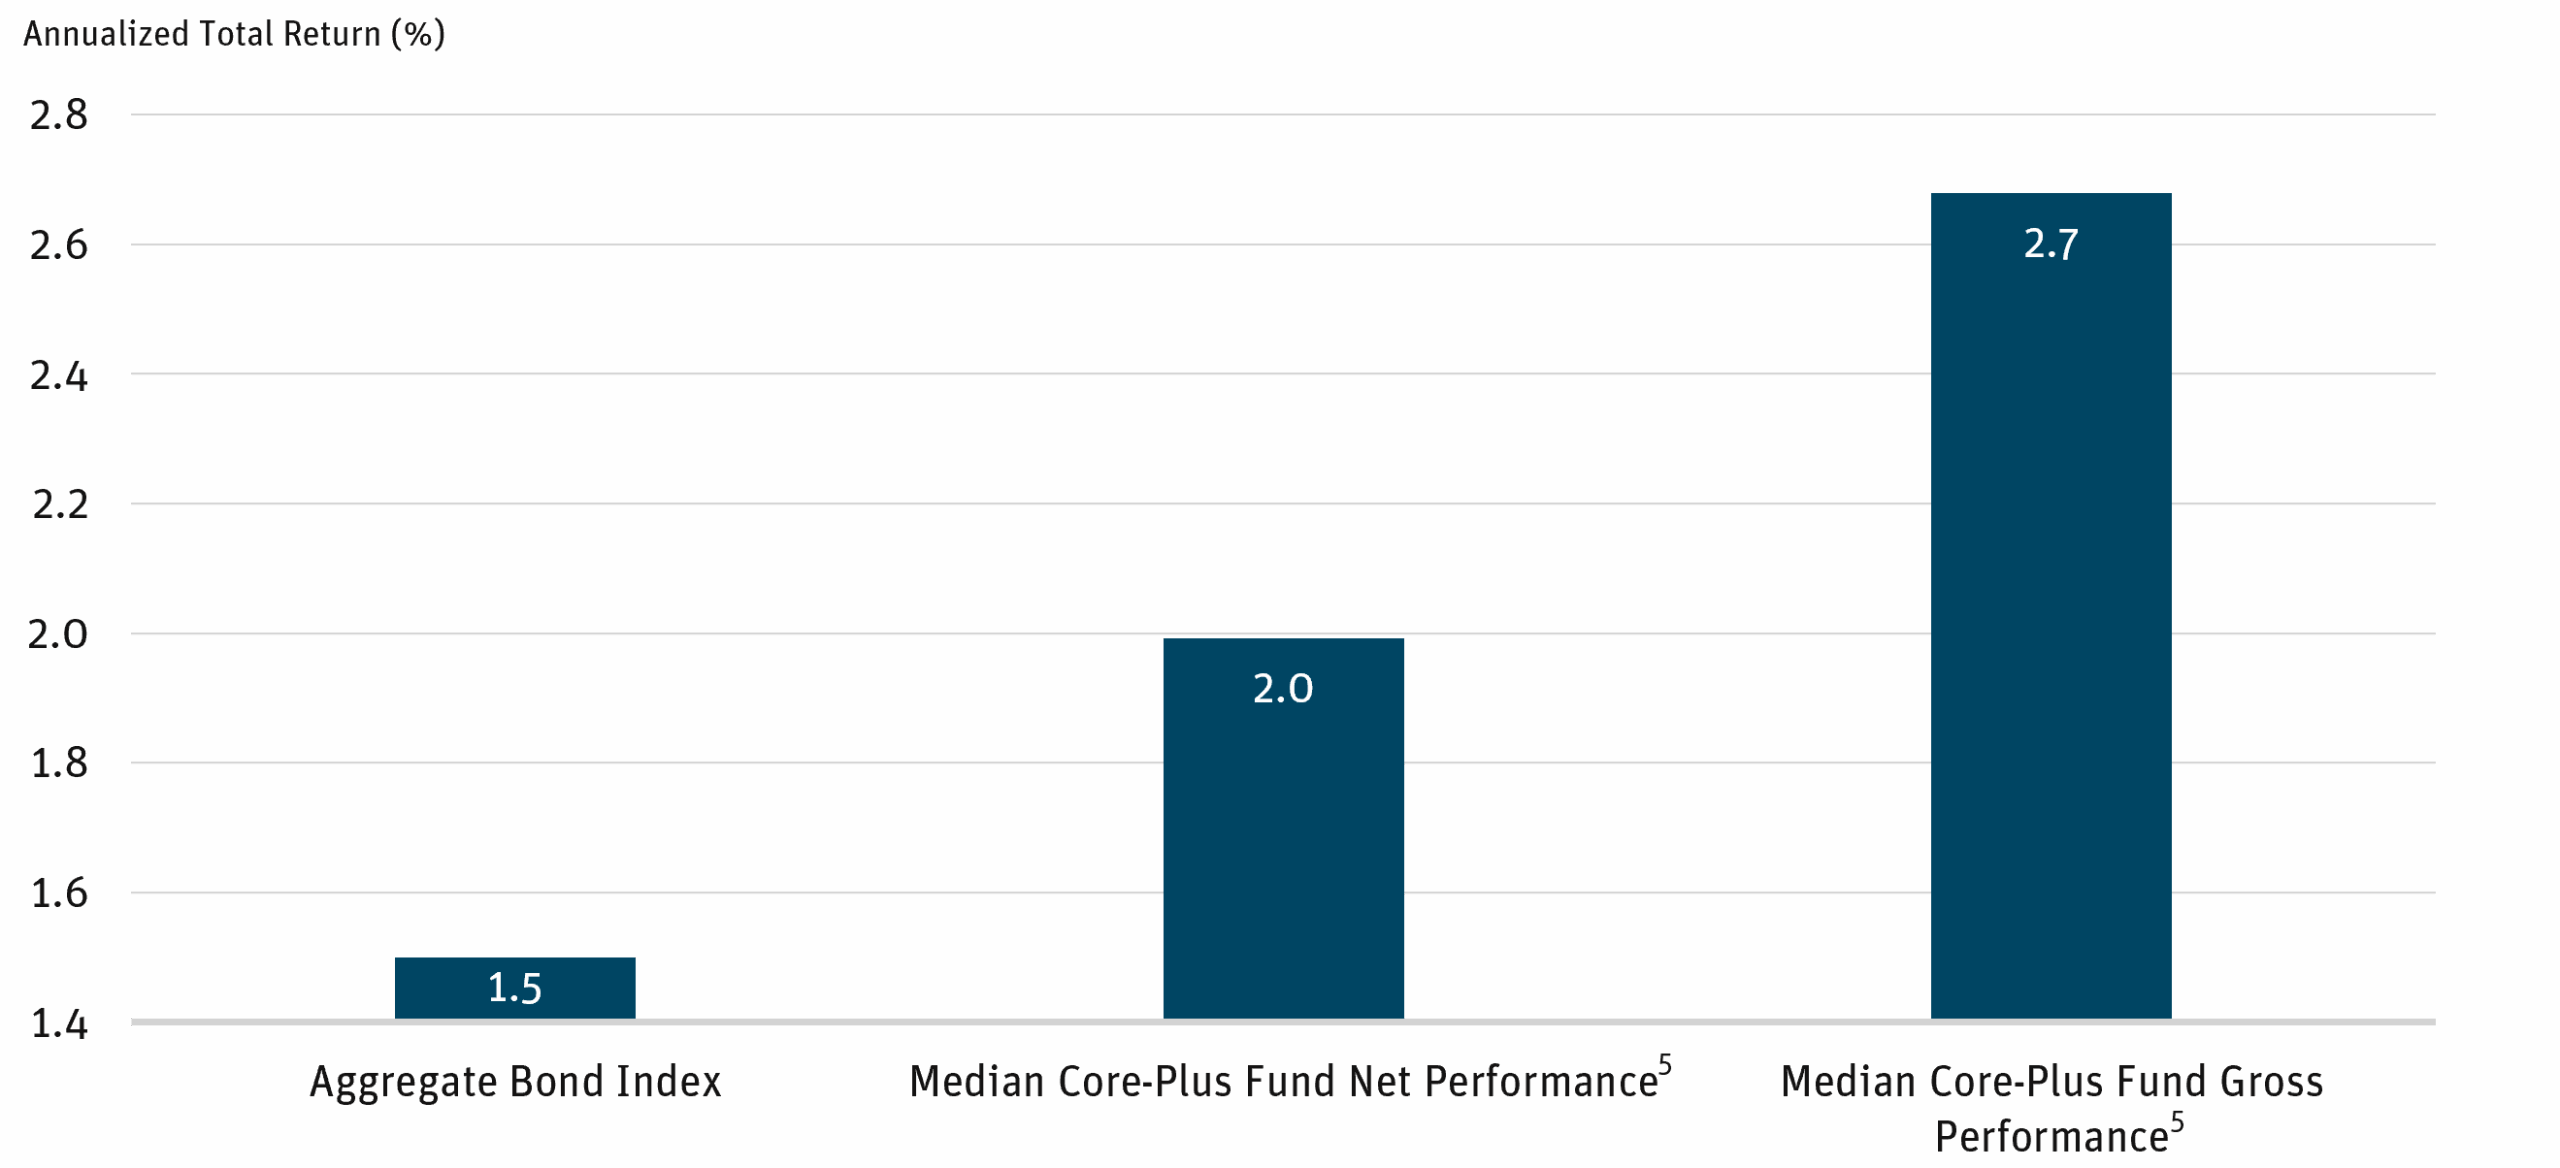
Source: Morningstar as of 9/30/25.
Over the three-year period since interest rates peaked in 2022, the CorePlus category has outperformed the Agg even more strongly (see Figure 2). The Median Core-Plus Category returned an annualized net return of 5.58% versus the Agg’s 4.90%, an annual outperformance of approximately 70 basis points.
Figure 2: Three-Year Performance Through September 2025
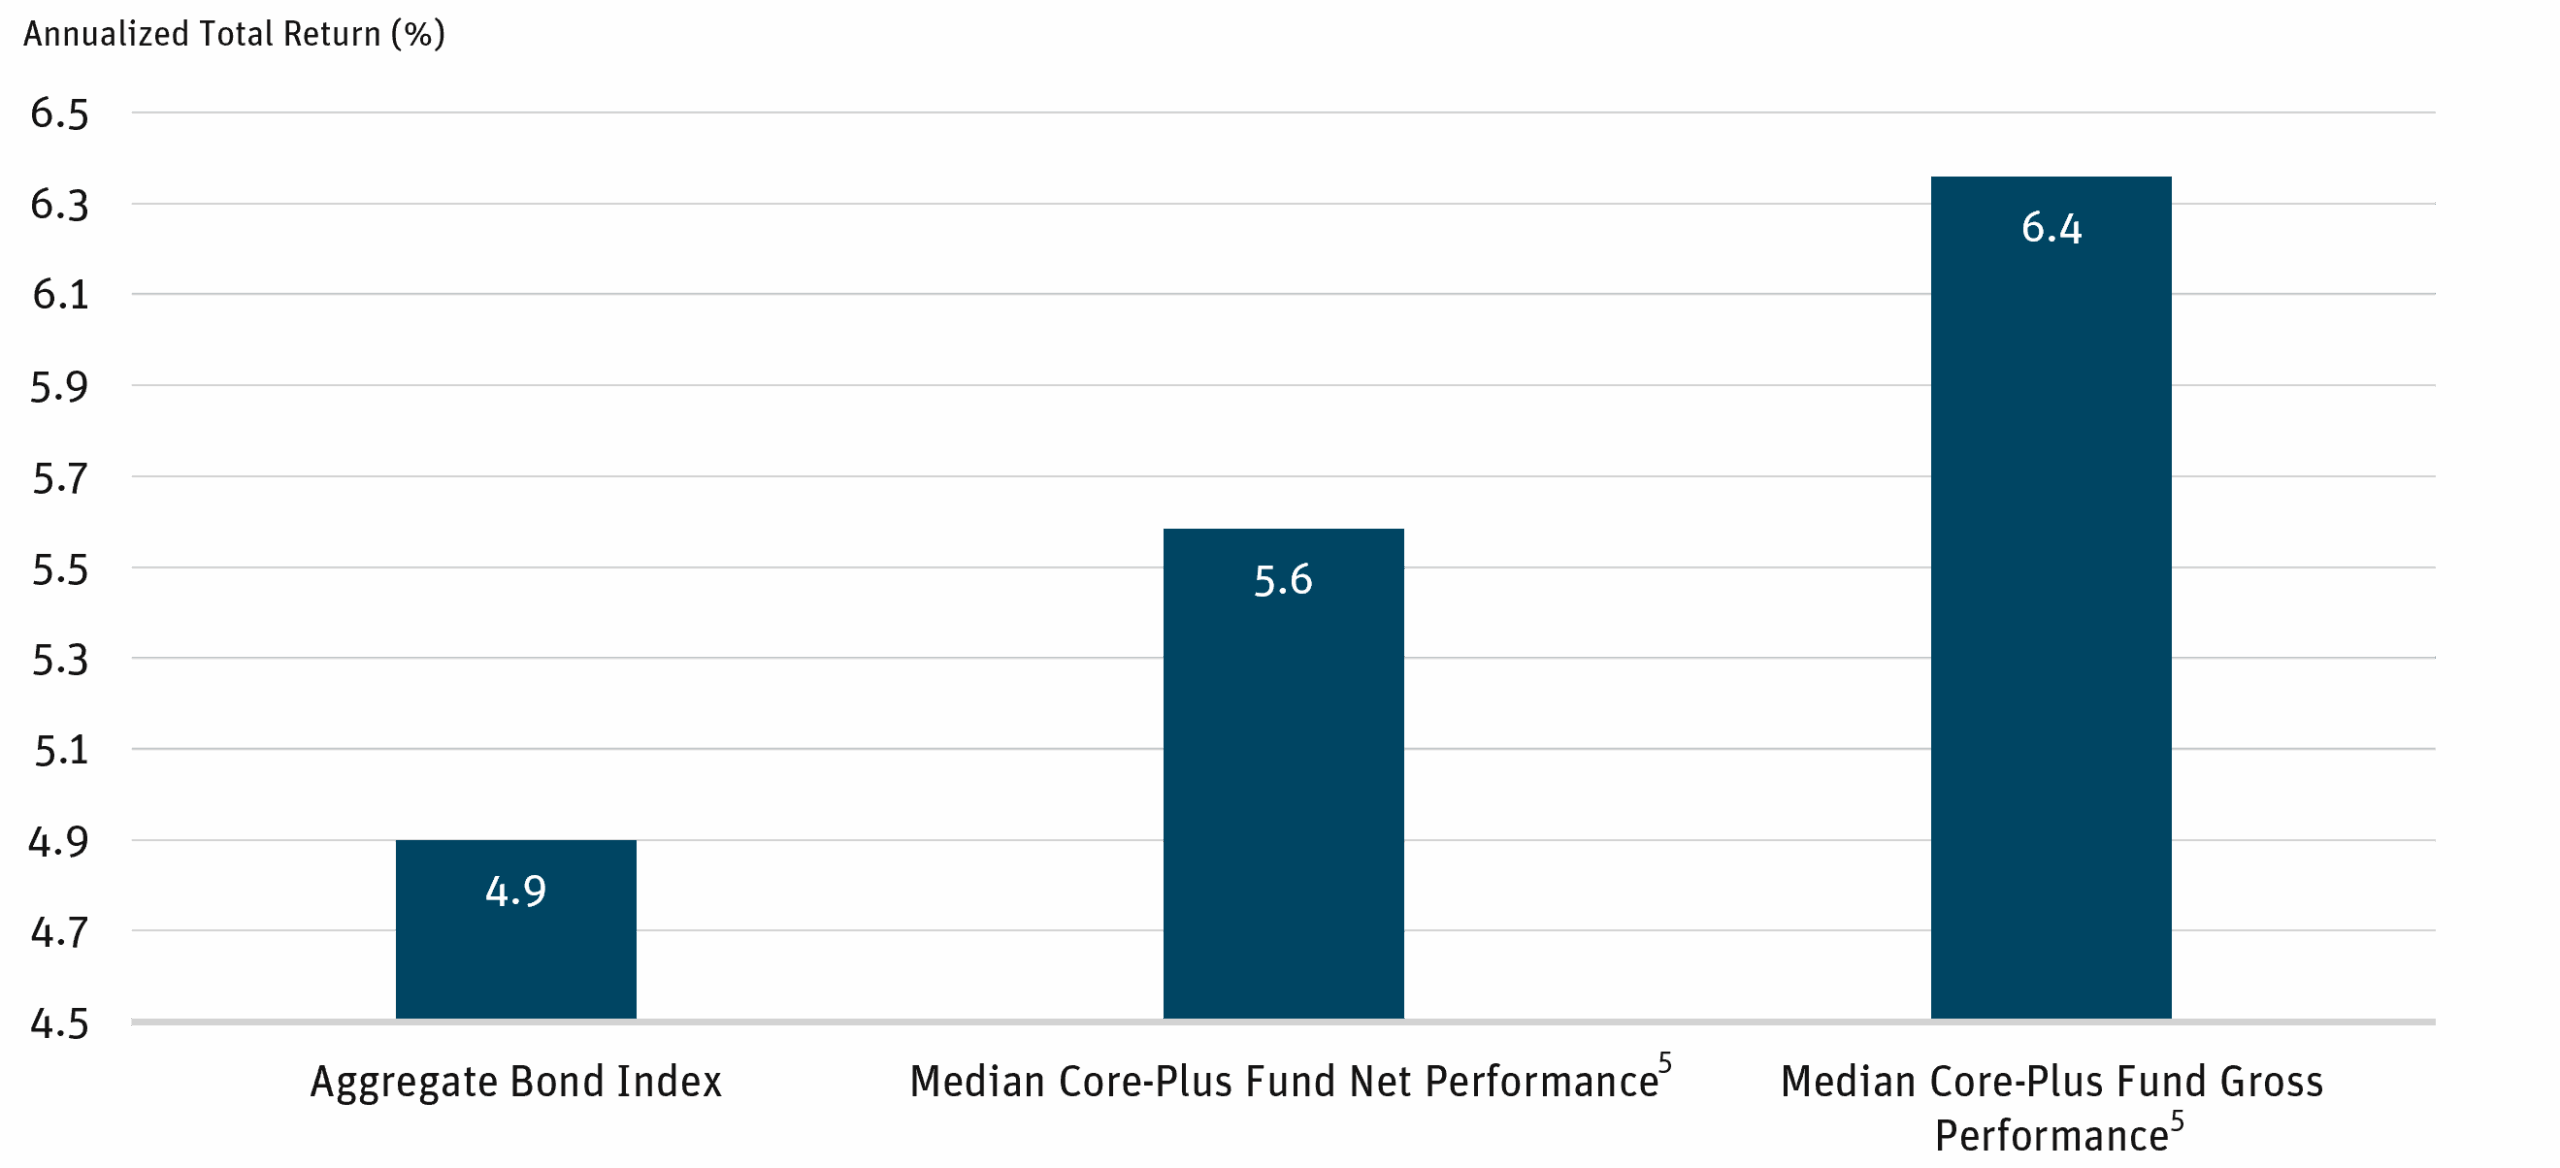
Source: Morningstar as of 9/30/25.
In addition to market outperformance, total assets invested in this category have grown significantly. At inception in 2019, $650 billion was invested in Core-Plus bond funds across mutual funds and exchange traded funds (ETFs). As of November 2025, that figure has increased to more than $900 billion. Assets under management in this category have grown at an annual rate of more than 10% since interest rates peaked at the end of 2022.
THE BLOOMBERG AGGREGATE BOND INDEX
Building an investment process that delivers outperformance relative to the benchmark begins with understanding the composition of the Agg.
- The index is primarily composed of U.S. agency mortgage-backed securities (MBS), U.S. Treasuries, and U.S. IG corporate bonds.
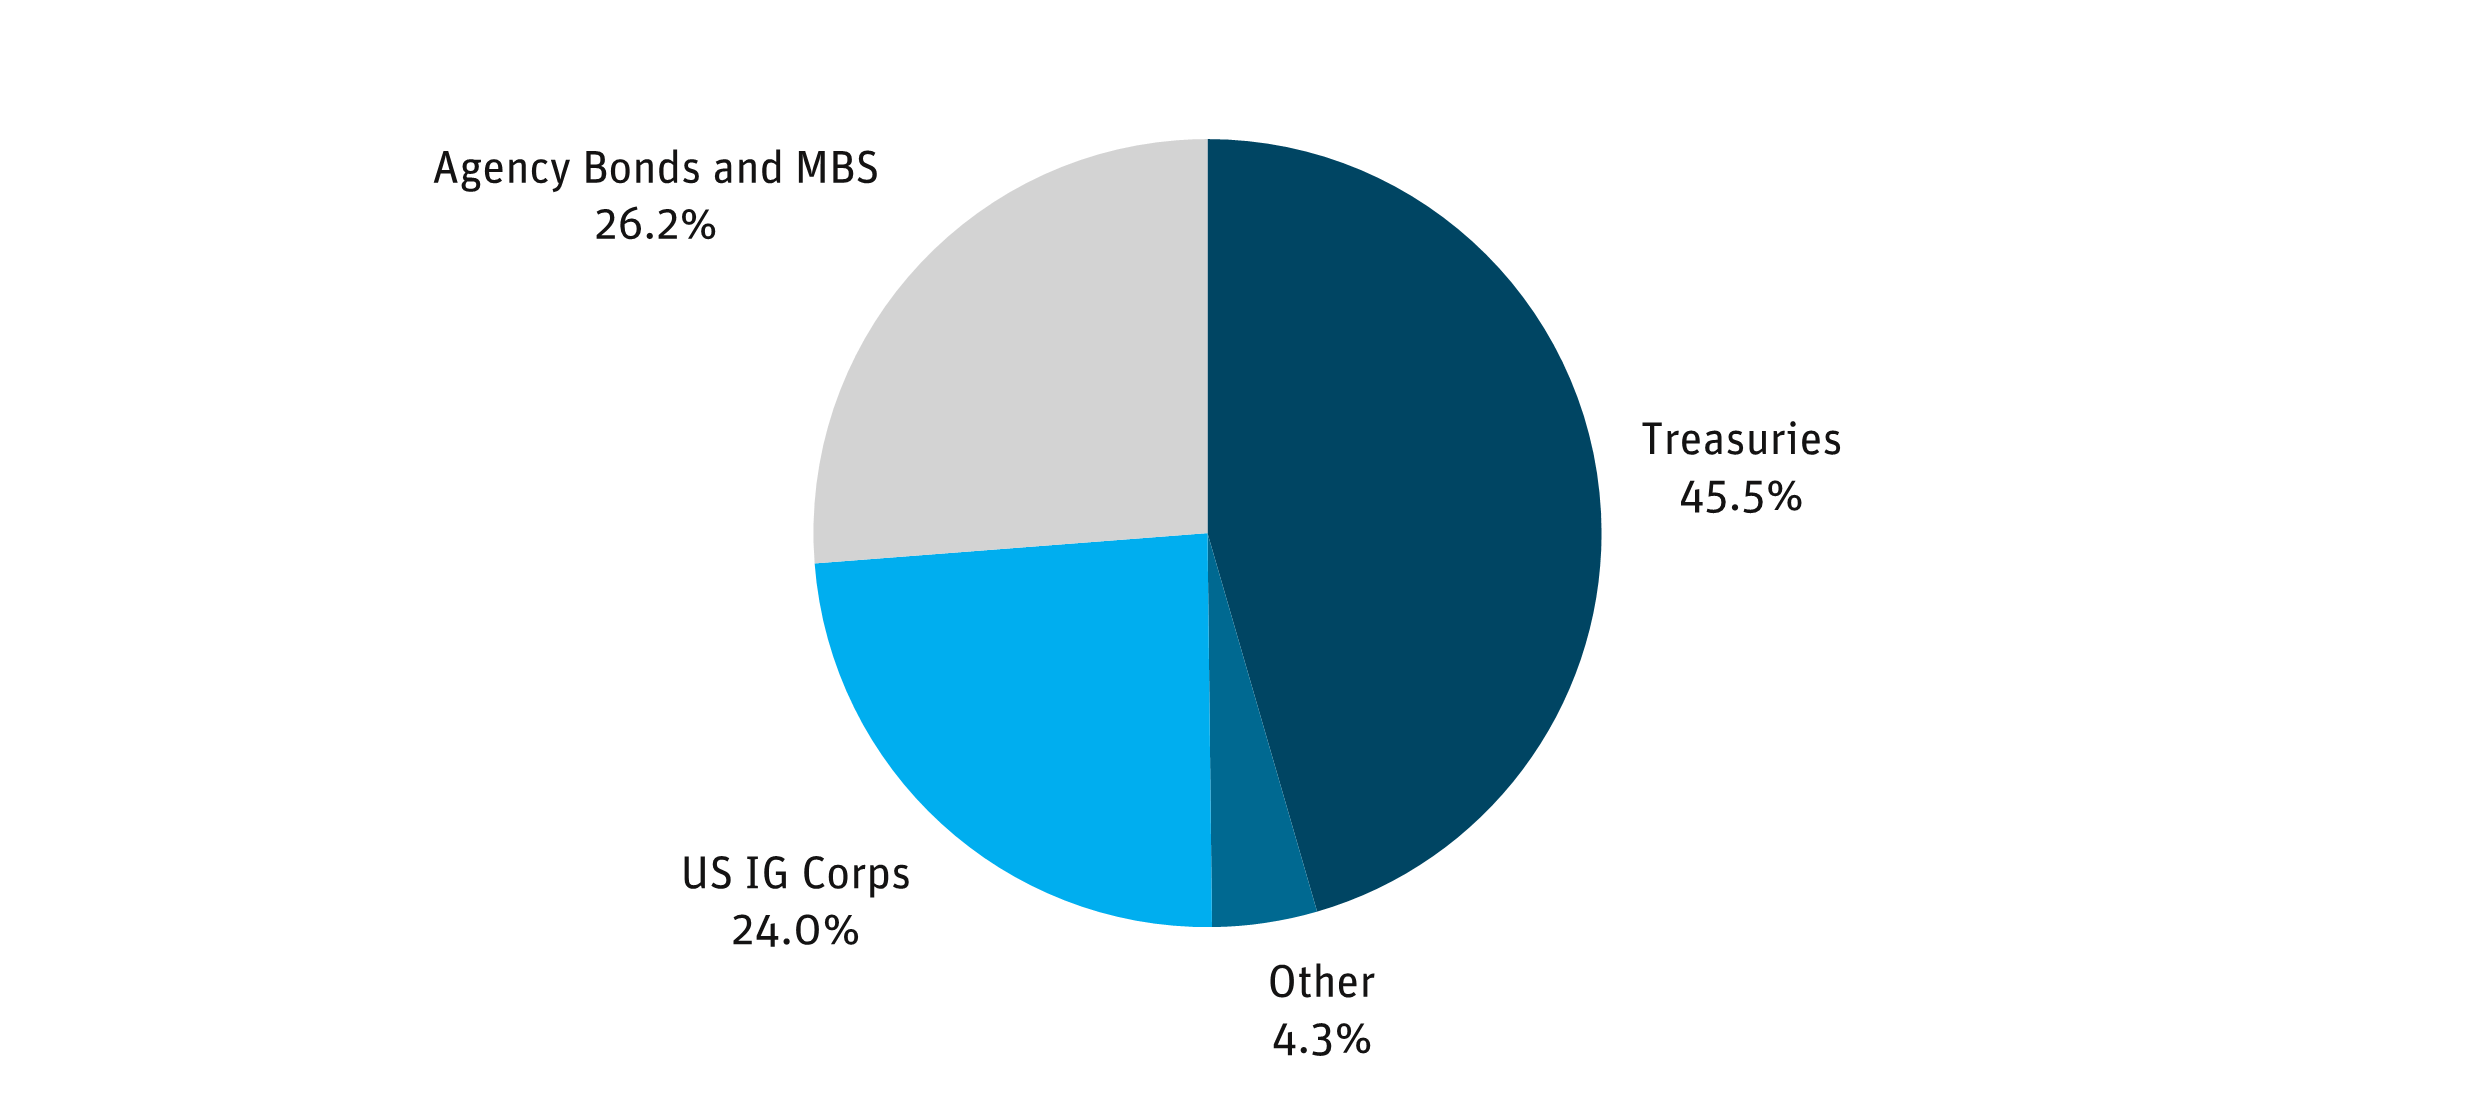
Source: Bloomberg as of 9/30/25.
- About one-quarter of the index consists of credit-risky corporate bonds, while the remainder is bonds issued or guaranteed by the U.S. government with minimal credit risk.
- Of those government-backed bonds, roughly two-thirds are U.S. Treasuries, while the rest are agency-guaranteed MBS.
- The percentage of the index allocated to credit remains relatively stable over time, with any allocation drift occurring gradually.
- The credit allocation includes only IG corporate bonds and excludes HY bonds.
- The index is market-capitalization-weighted, meaning securities are weighted by the total market size of outstanding bonds.
- Duration has been relatively stable over time and is currently approximately six years.
DELIVERING PERFORMANCE RELATIVE TO THE AGG
Given these factors, building an investment process designed to deliver strong benchmark-relative returns over a cycle in a Core-Plus bond strategy involves six key elements:
- Strategically overweight bonds that include credit risk and the associated spread premium relative to the benchmark weighting.
- Tactically adjust the size of the credit allocation based on market conditions and relative value opportunities (i.e., avoid maintaining a static credit allocation over time).
- Add “off-benchmark” instruments such as securitized or HY bonds to the credit allocation, as these tend to outperform over a cycle given their credit, convexity, and liquidity premiums.
- Overweight agency MBS within the government allocation when they offer a historical spread premium relative to Treasuries.
- Move away from capitalization-weighted allocations in credit and adopt a proven security-selection process, particularly in securitized and corporate credit.
- Limit active interest rate speculation by keeping duration in line with the benchmark. The value of each component of this process is illustrated below.
The value of each component of this process is illustrated below.
1. Credit Overweight
Figure 3 shows the annualized total return since 1997 for the three largest components of the Agg. Note that the U.S. IG credit index has significantly outperformed. As noted above, overweighting credit is the first key element to outperformance in a Core-Plus bond strategy. This approach allows the strategy the opportunity to take advantage of credit’s historical outperformance over a cycle.
Figure 3: Annualized Total Return Since 1997
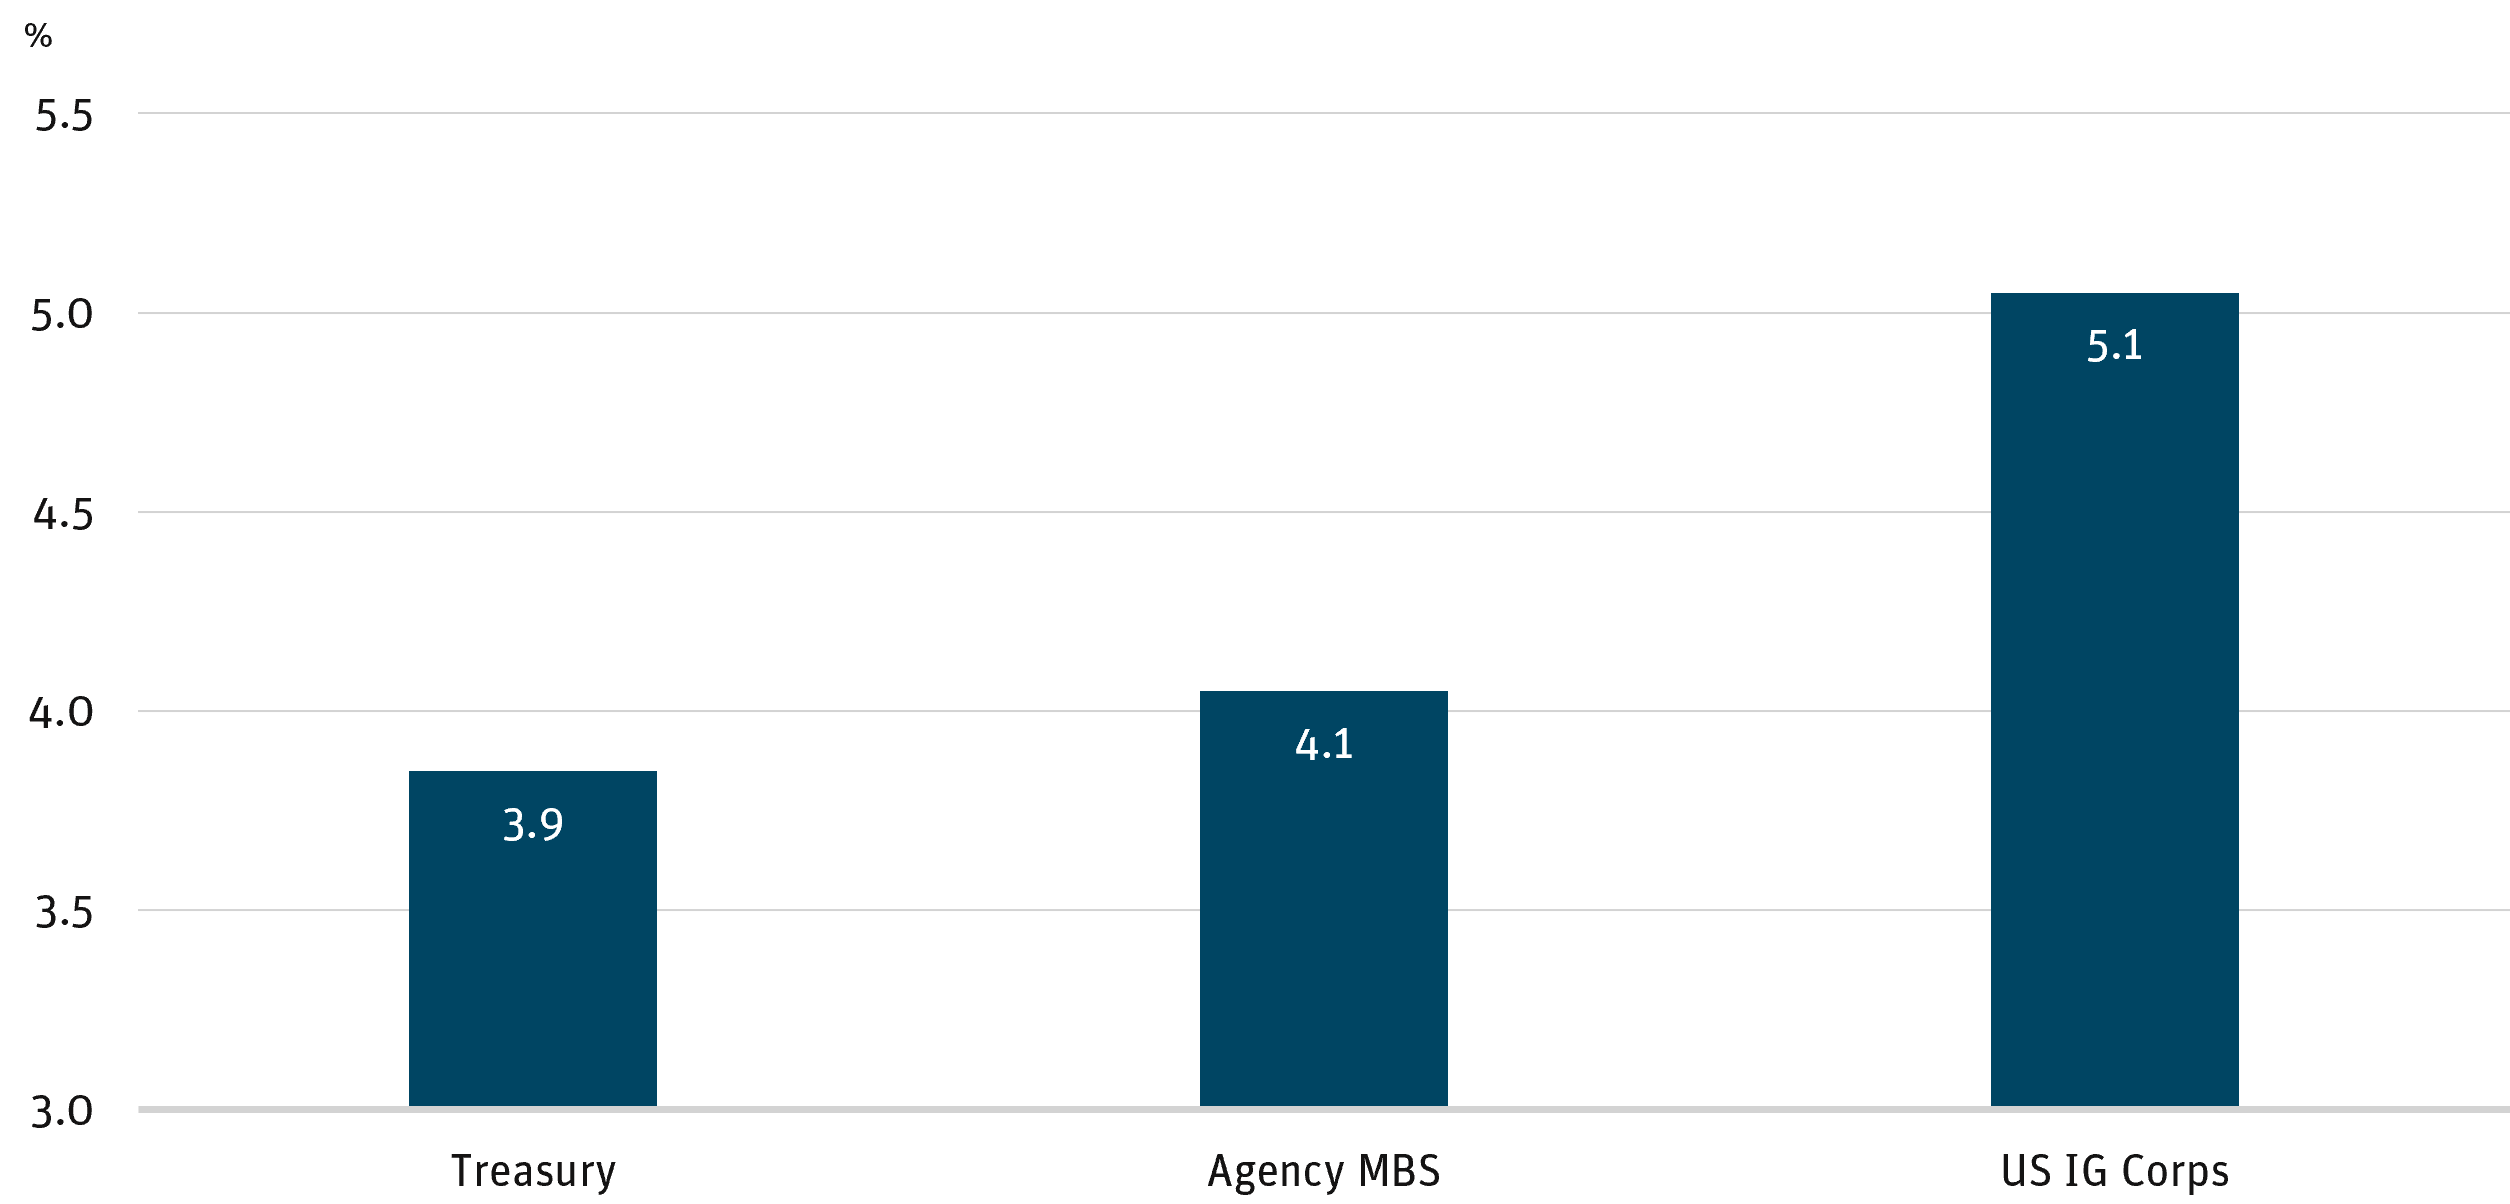
Source: Bloomberg as of 9/30/25.
2. Increase Credit Allocation When Spreads Are Wide
The opportunity set in credit varies over time. Figure 4 shows the U.S. IG corporate index spread, highlighting the variation in opportunities offered by the credit market.
Figure 4: Average Spread of IG Corporate Bond Index (1998–2025)
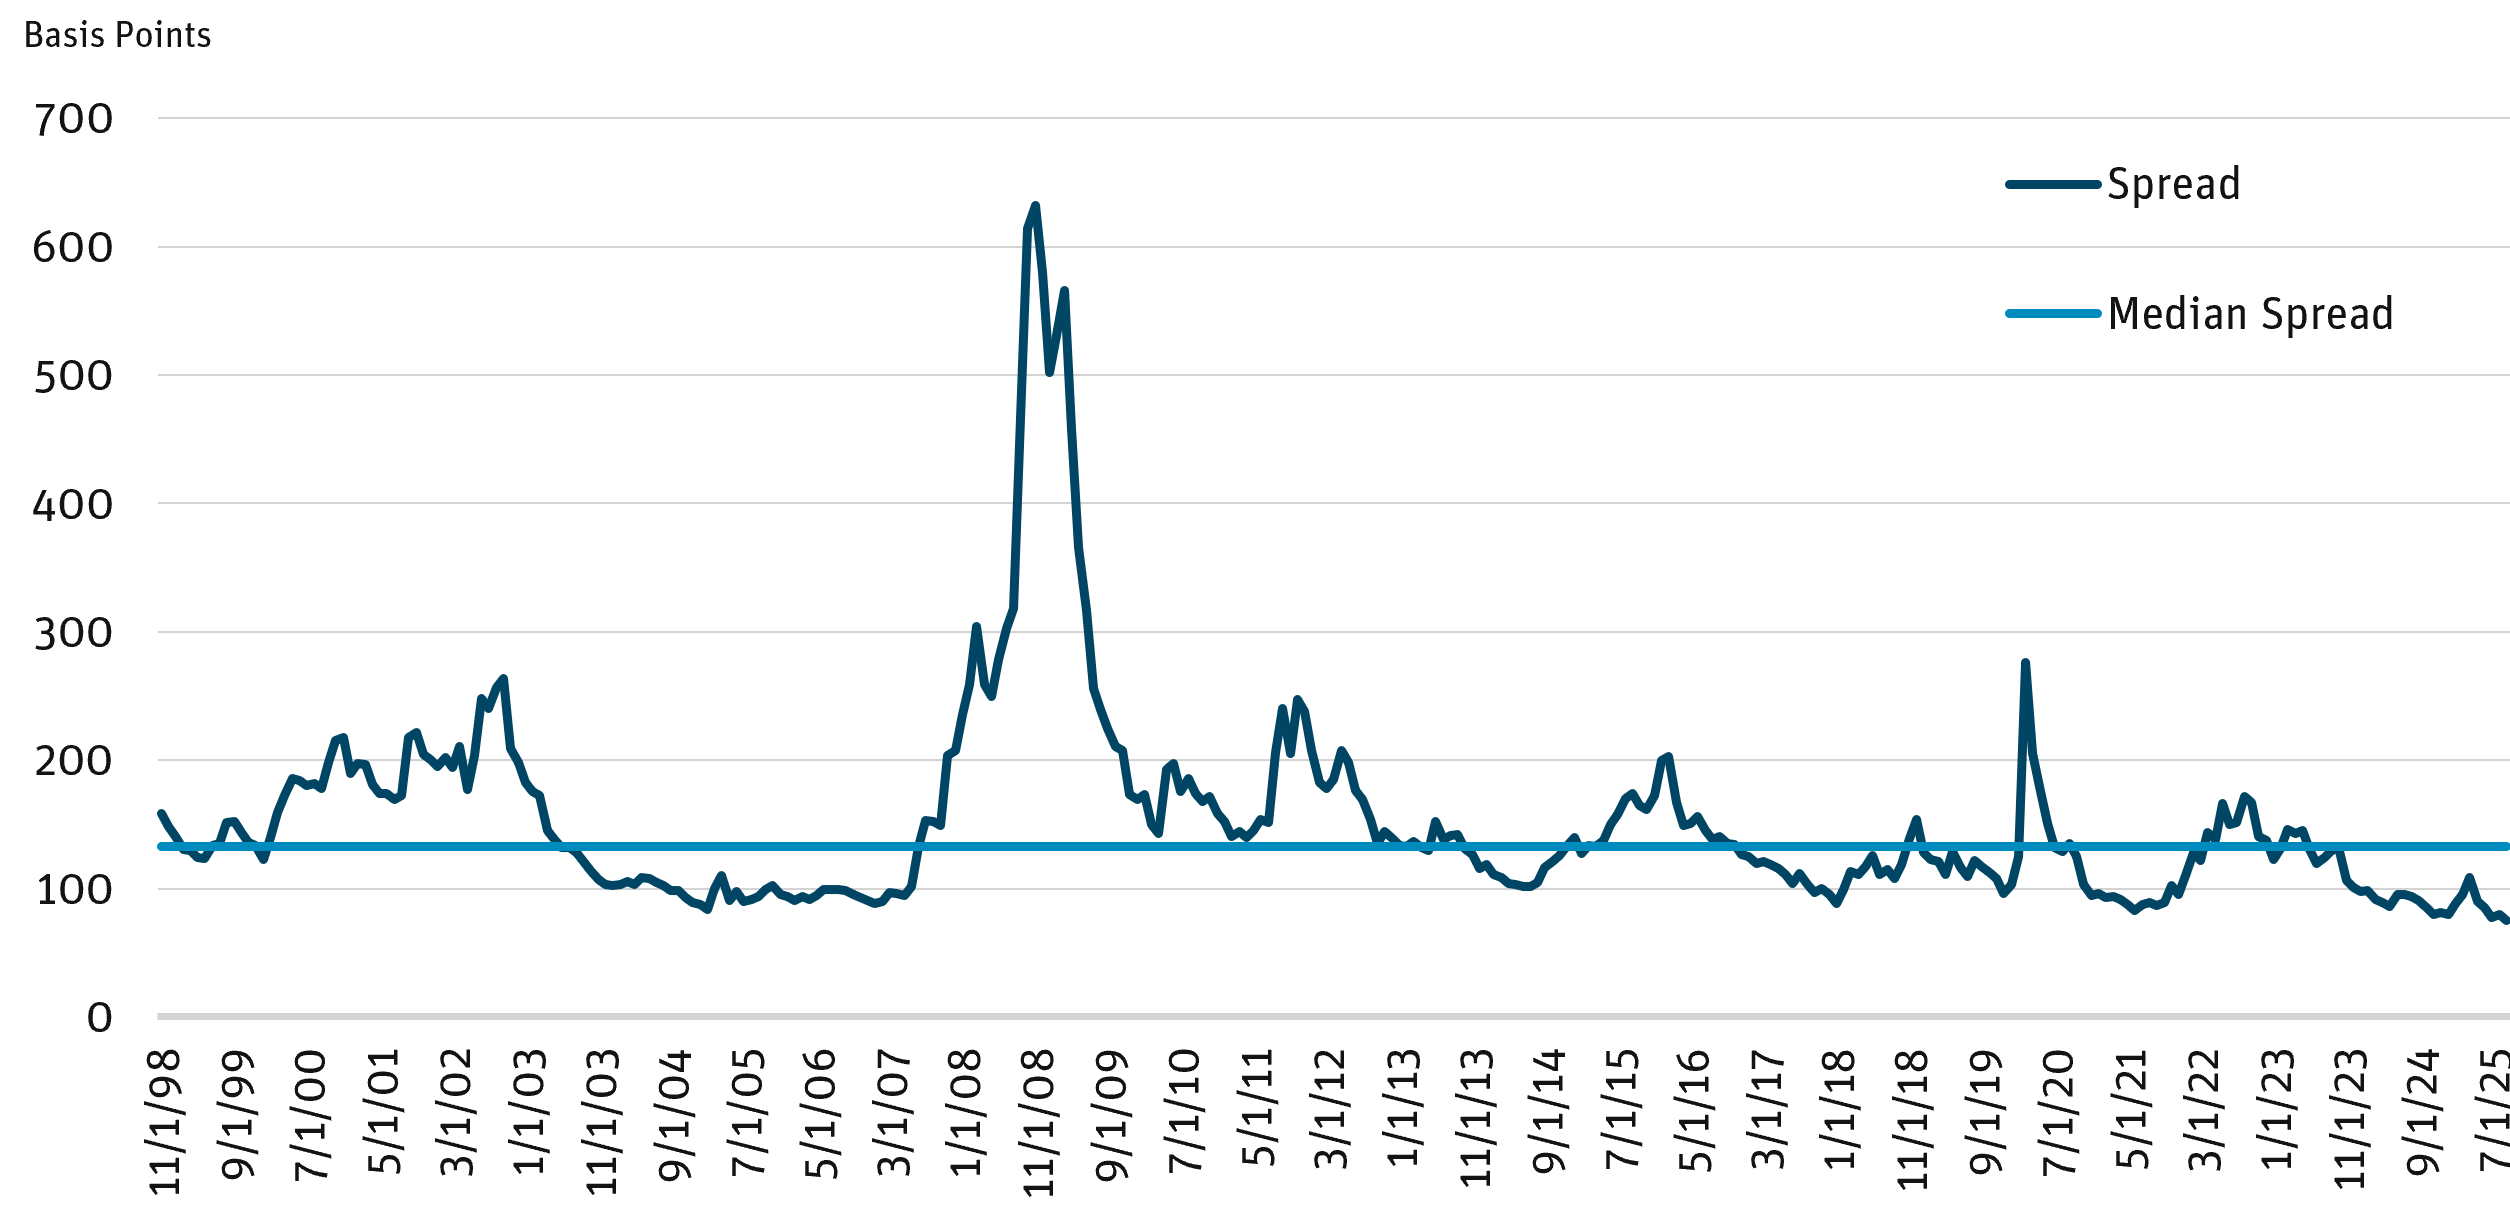
Source: Bloomberg as of 9/30/25.
Wide credit spreads have historically led to higher future returns, and vice versa. Figure 5 shows the average monthly excess return of the Corporate Bond index over the following one, three, and five years. Excess returns6 are greater when the index spread is above the median.
Figure 5: Average Excess Return of IG Corp. Bond Index (1998–2025)
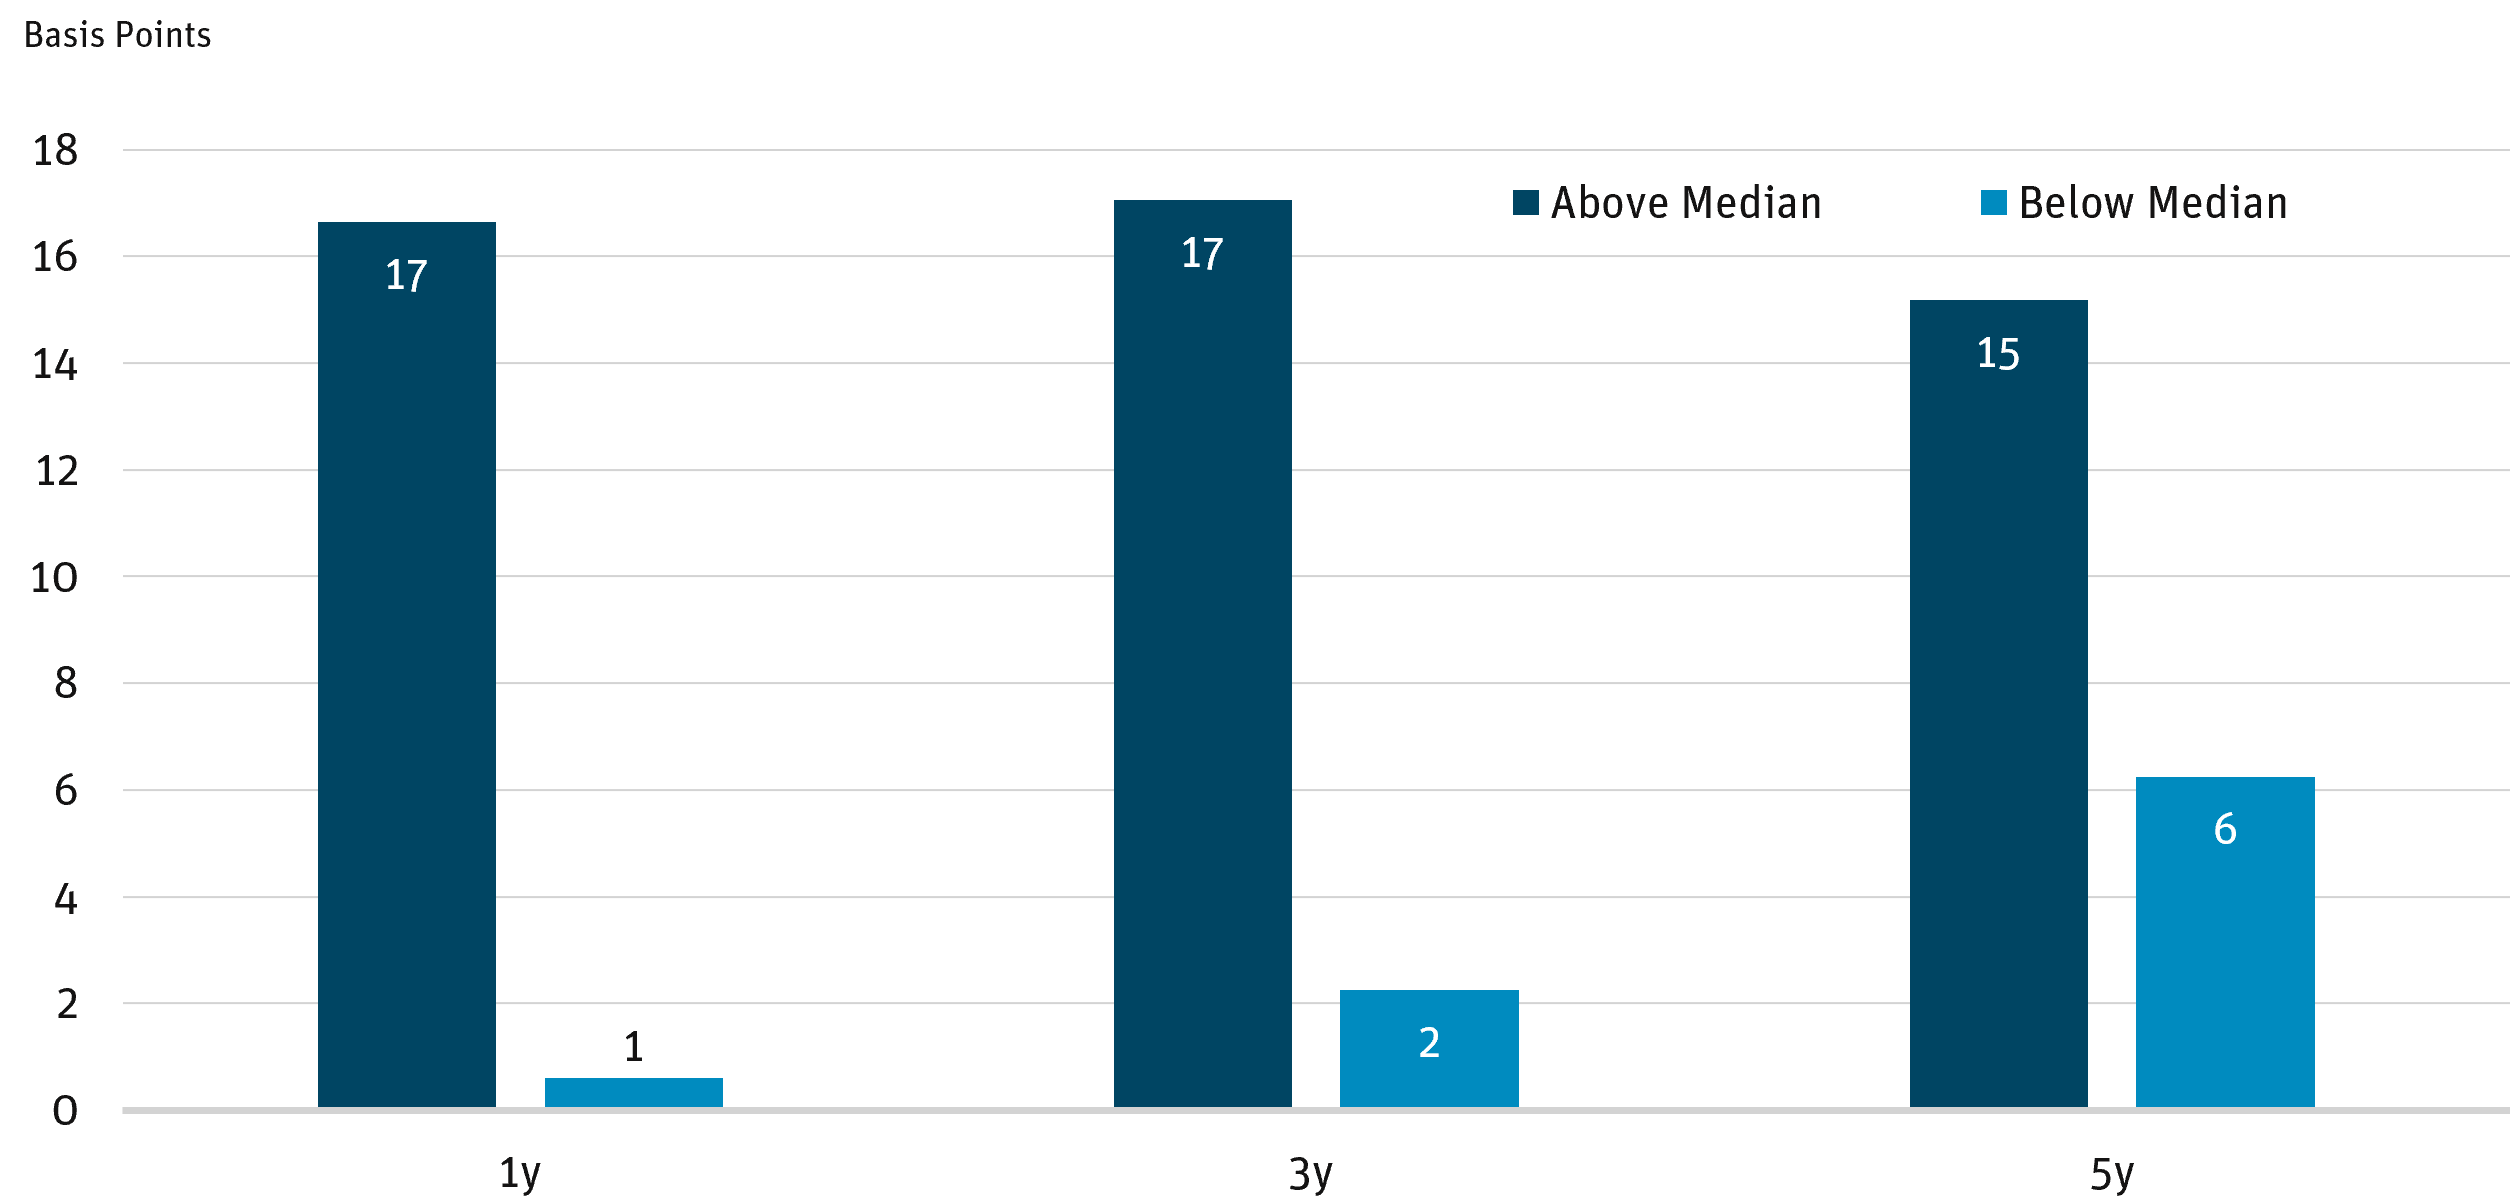
Source: Bloomberg, Angel Oak estimates as of 9/30/25.
3. Add Off-Benchmark Credits
The Agg allocates only to IG corporate bonds. Figure 6 shows the annualized performance of each rating category in corporate debt from AAA to Single-B7 since 1993. BBB-, BB-, and B-rated bonds have experienced the strongest performance. BB- and B-rated bonds are not in the benchmark. We believe adding below-IG bonds that have historically performed better will help drive index outperformance over a cycle.
Figure 6: Annualized Total Return (1993–2025)
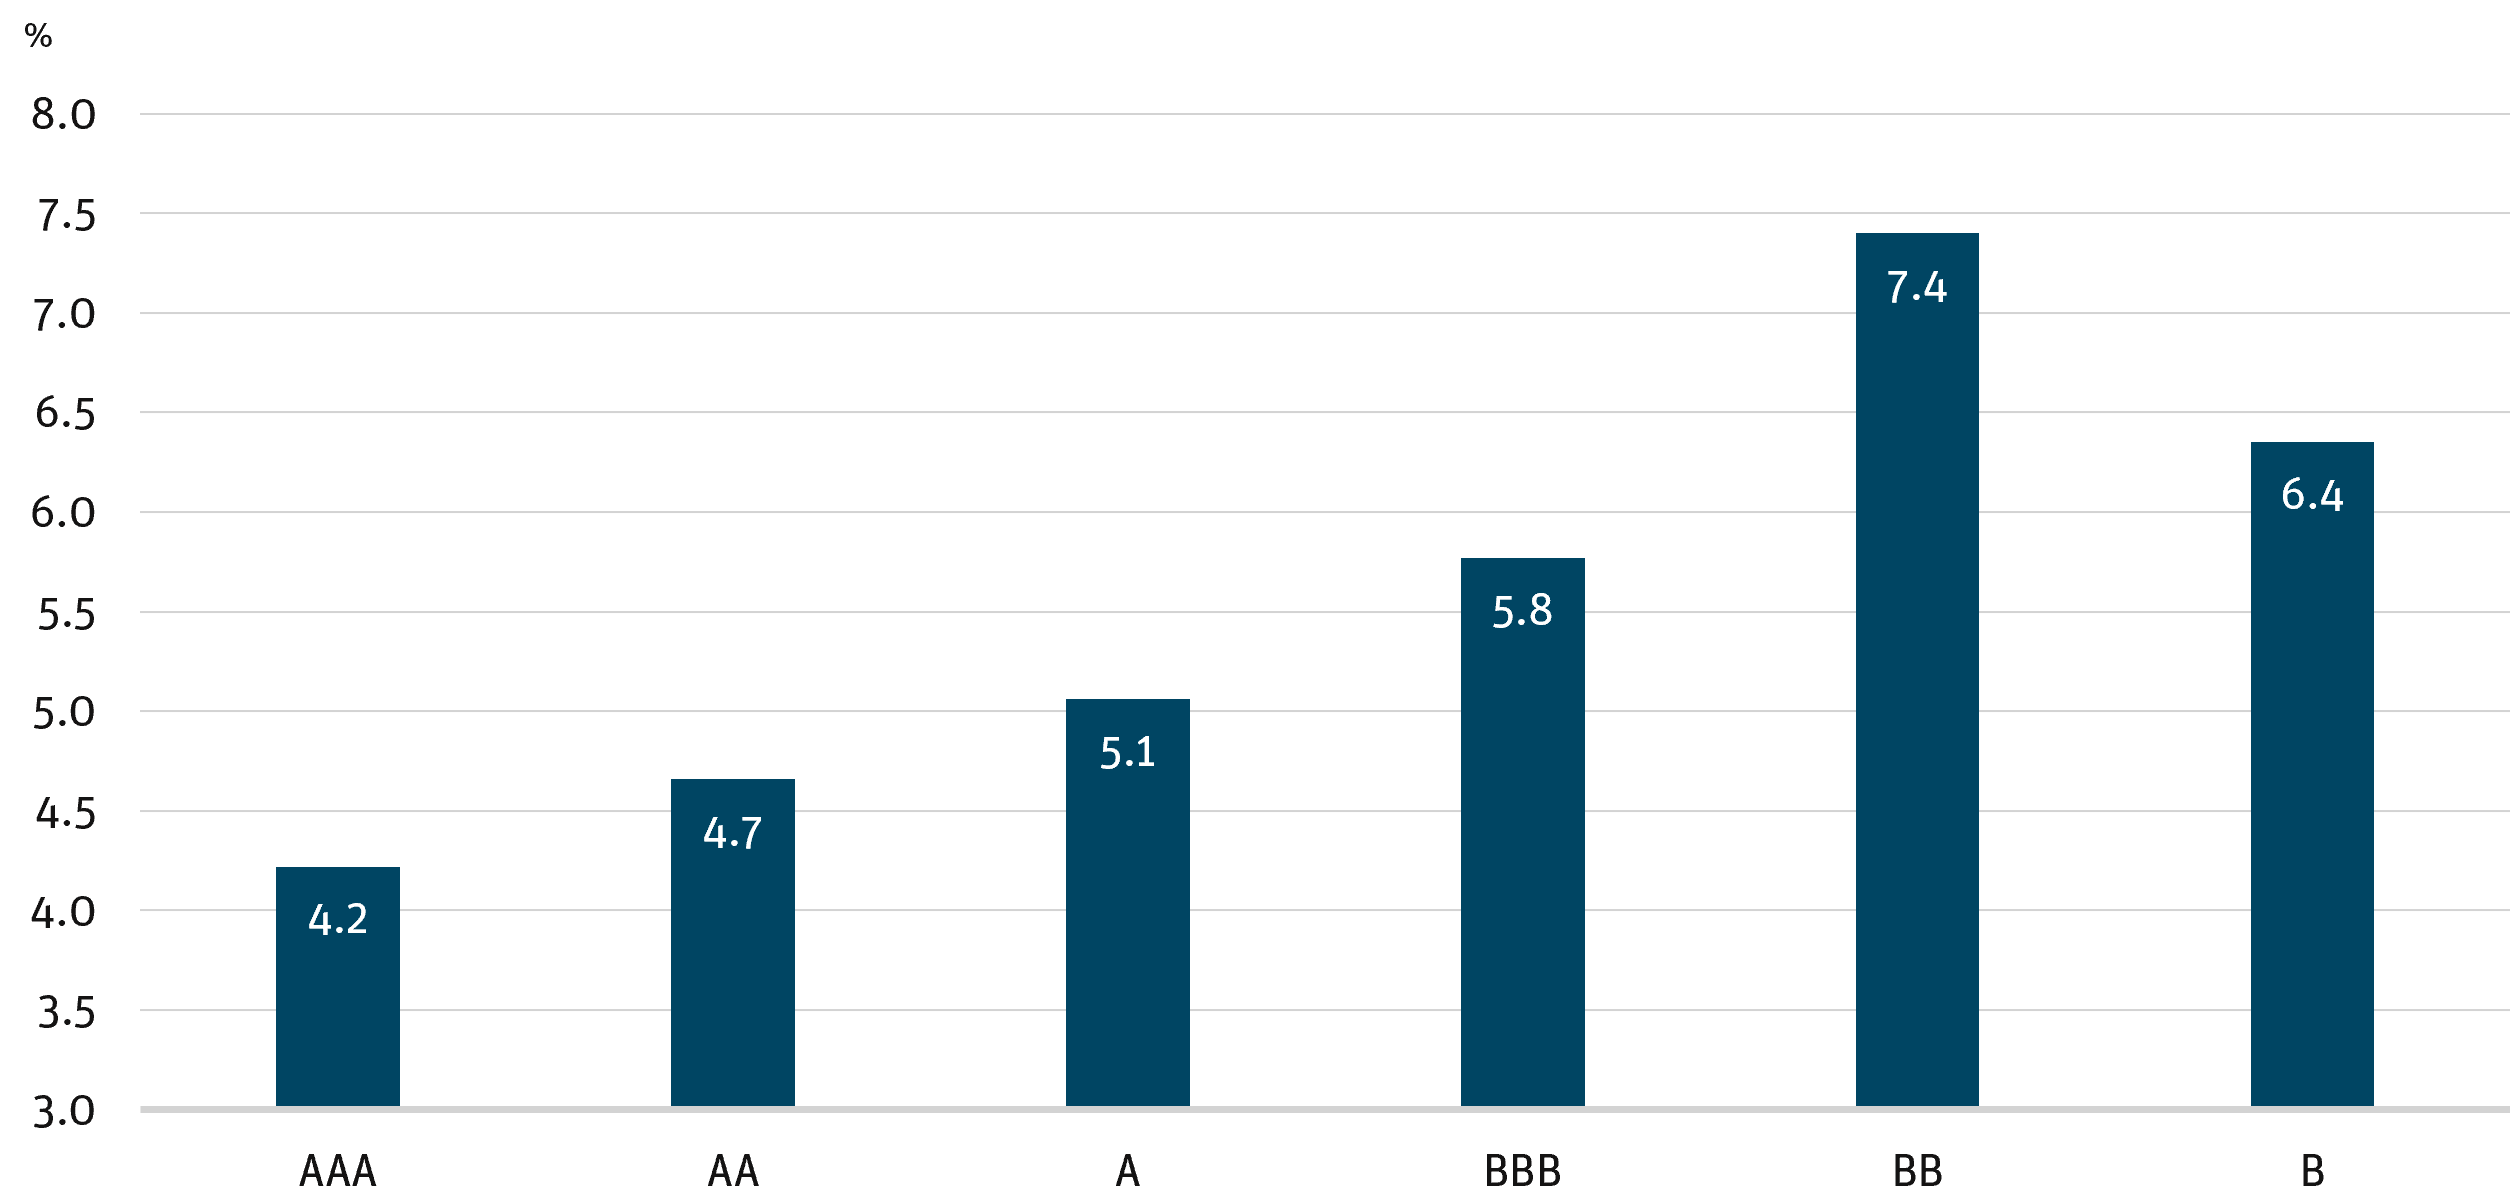
Source: Bloomberg, Angel Oak estimates as of 9/30/25.
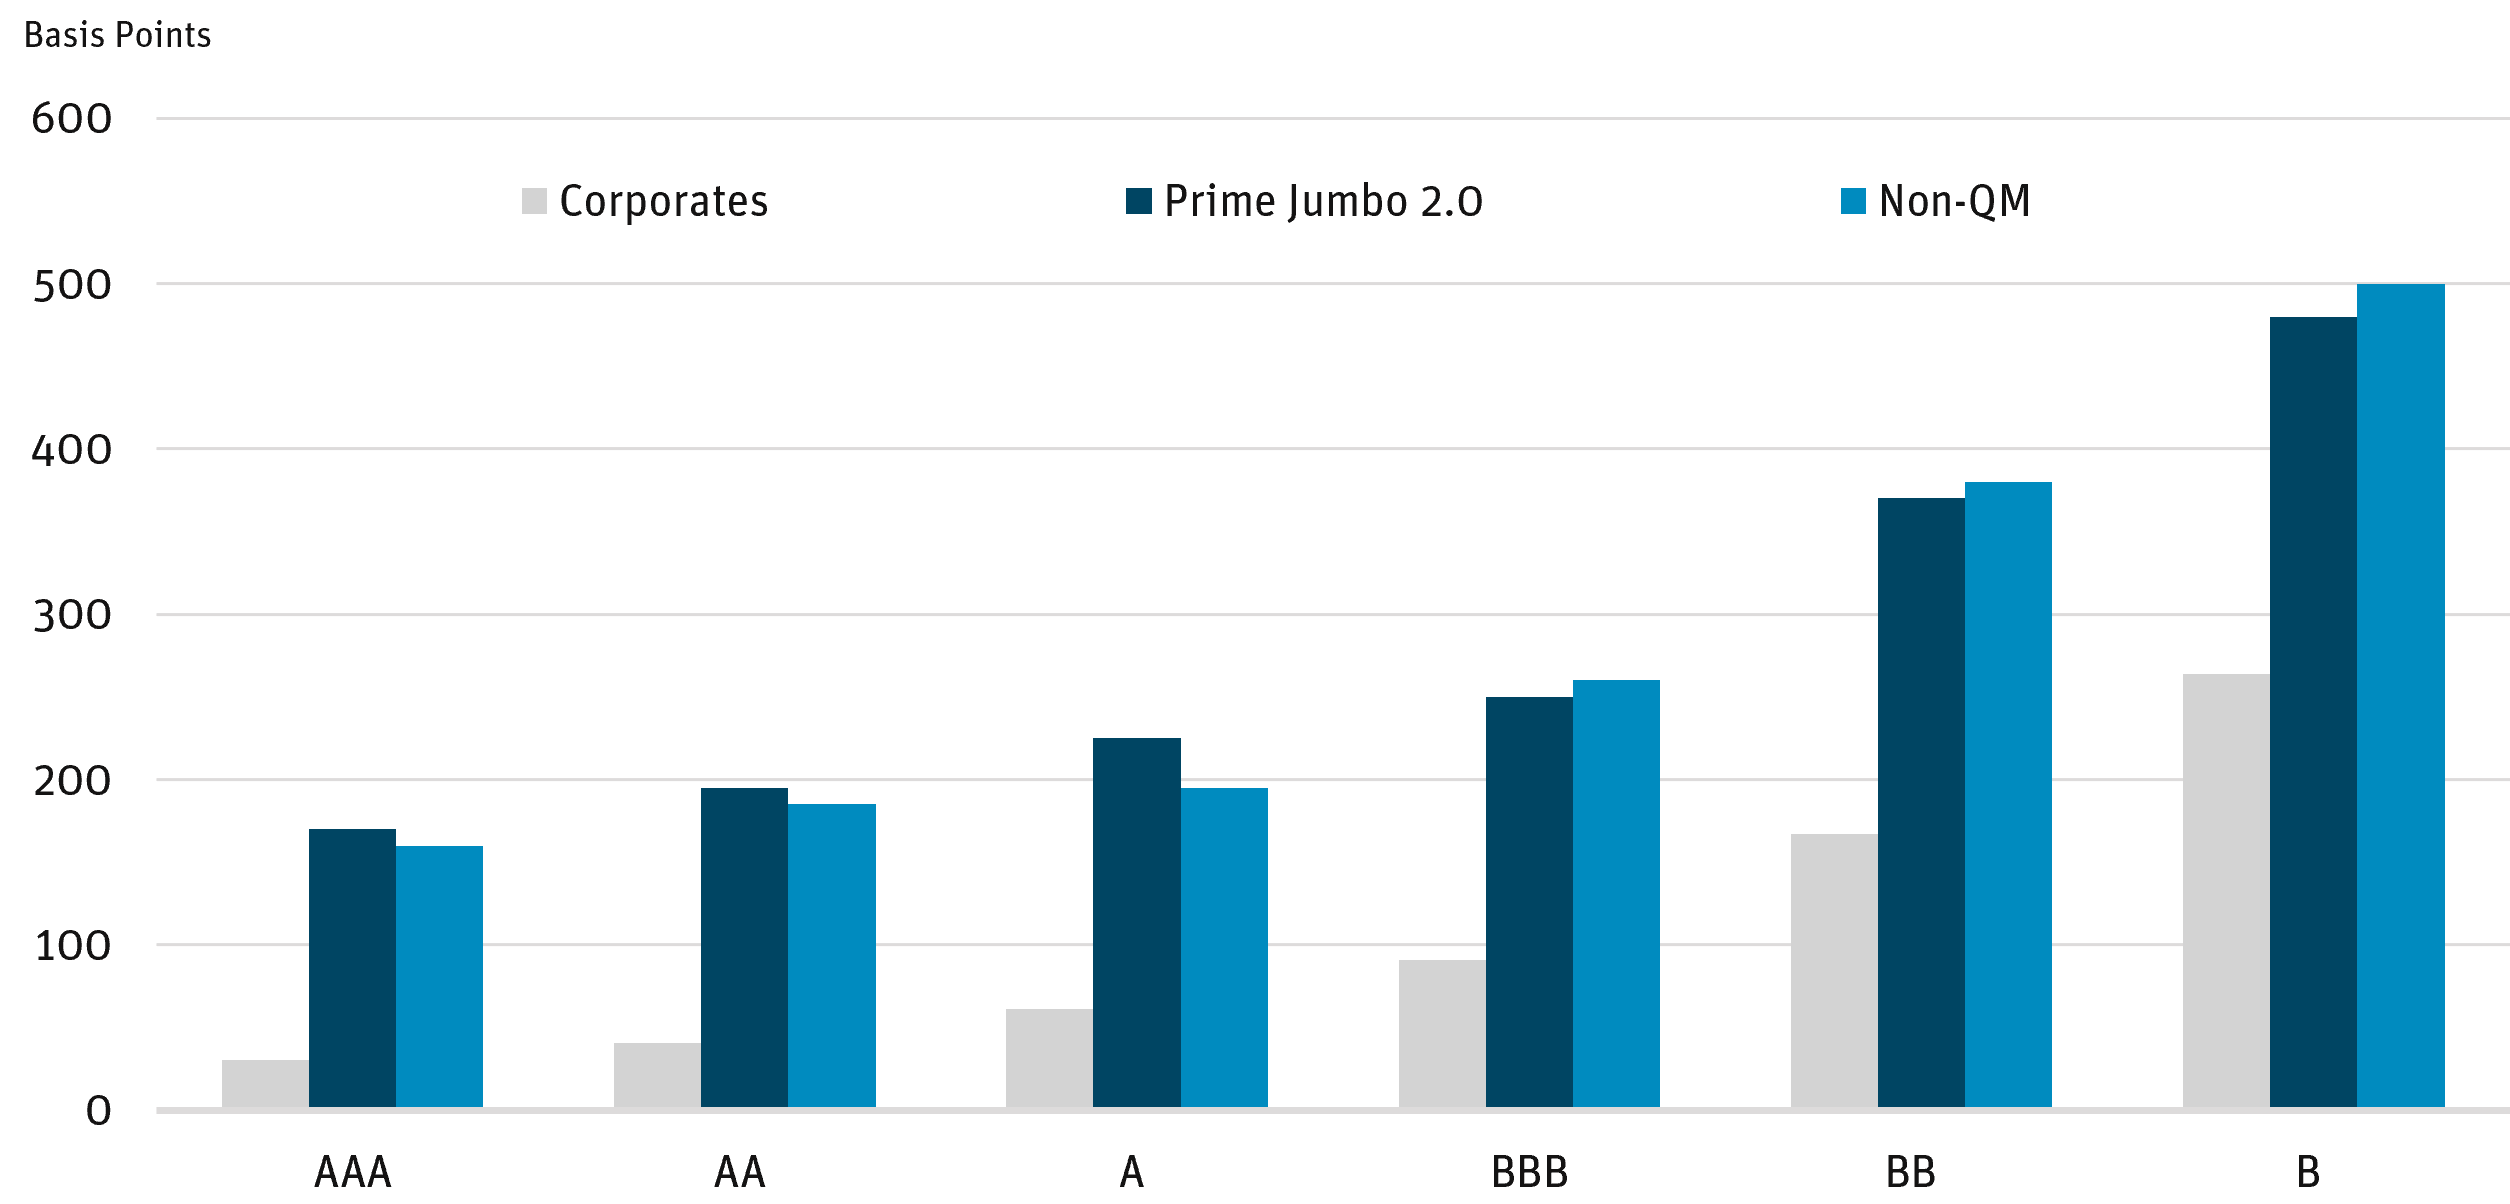
In addition to off-benchmark positions in below-IG corporate bonds, securitized credit bonds—such as non-qualified mortgage (non-QM) RMBS, prime jumbo RMBS, credit card and auto ABS, and CLOs—tend to offer a premium relative to corporate credit (Figure 7) 8. While this securitized credit premium can vary over time, we believe it adds outperformance to a credit allocation over a market cycle.
Figure 7: Securitized Credit Has Historically Outperformed Corp. Credit
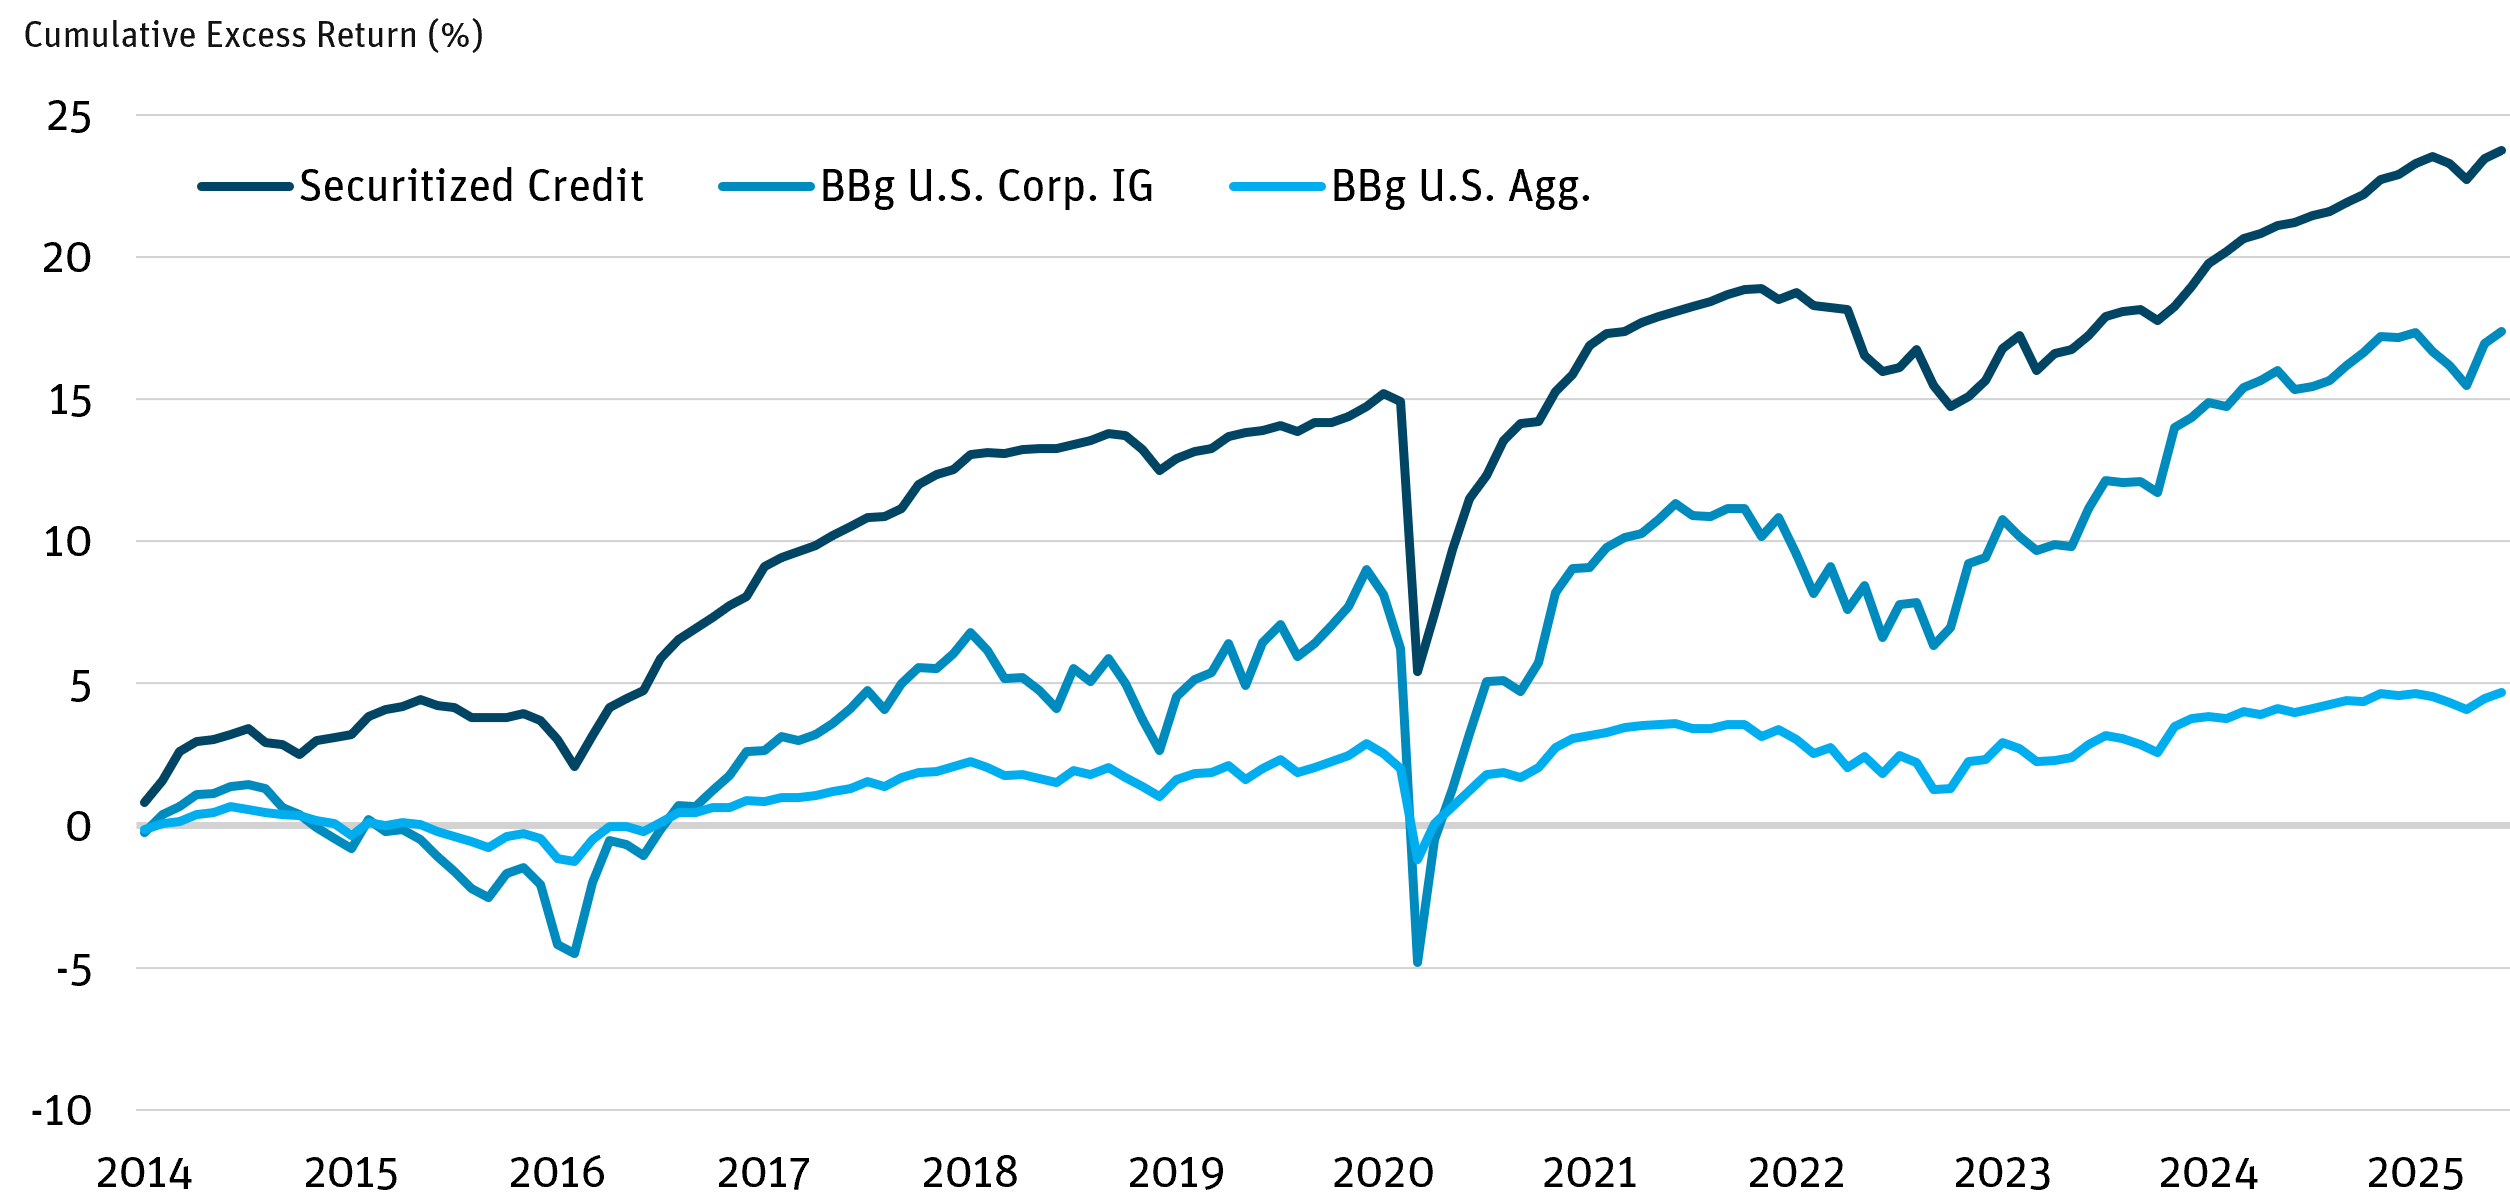
Source: BofA Global Research as of 5/31/25.
Figure 8: Risk-Adjusted Returns Greater in Structured Credit vs. U.S. Corp. IG
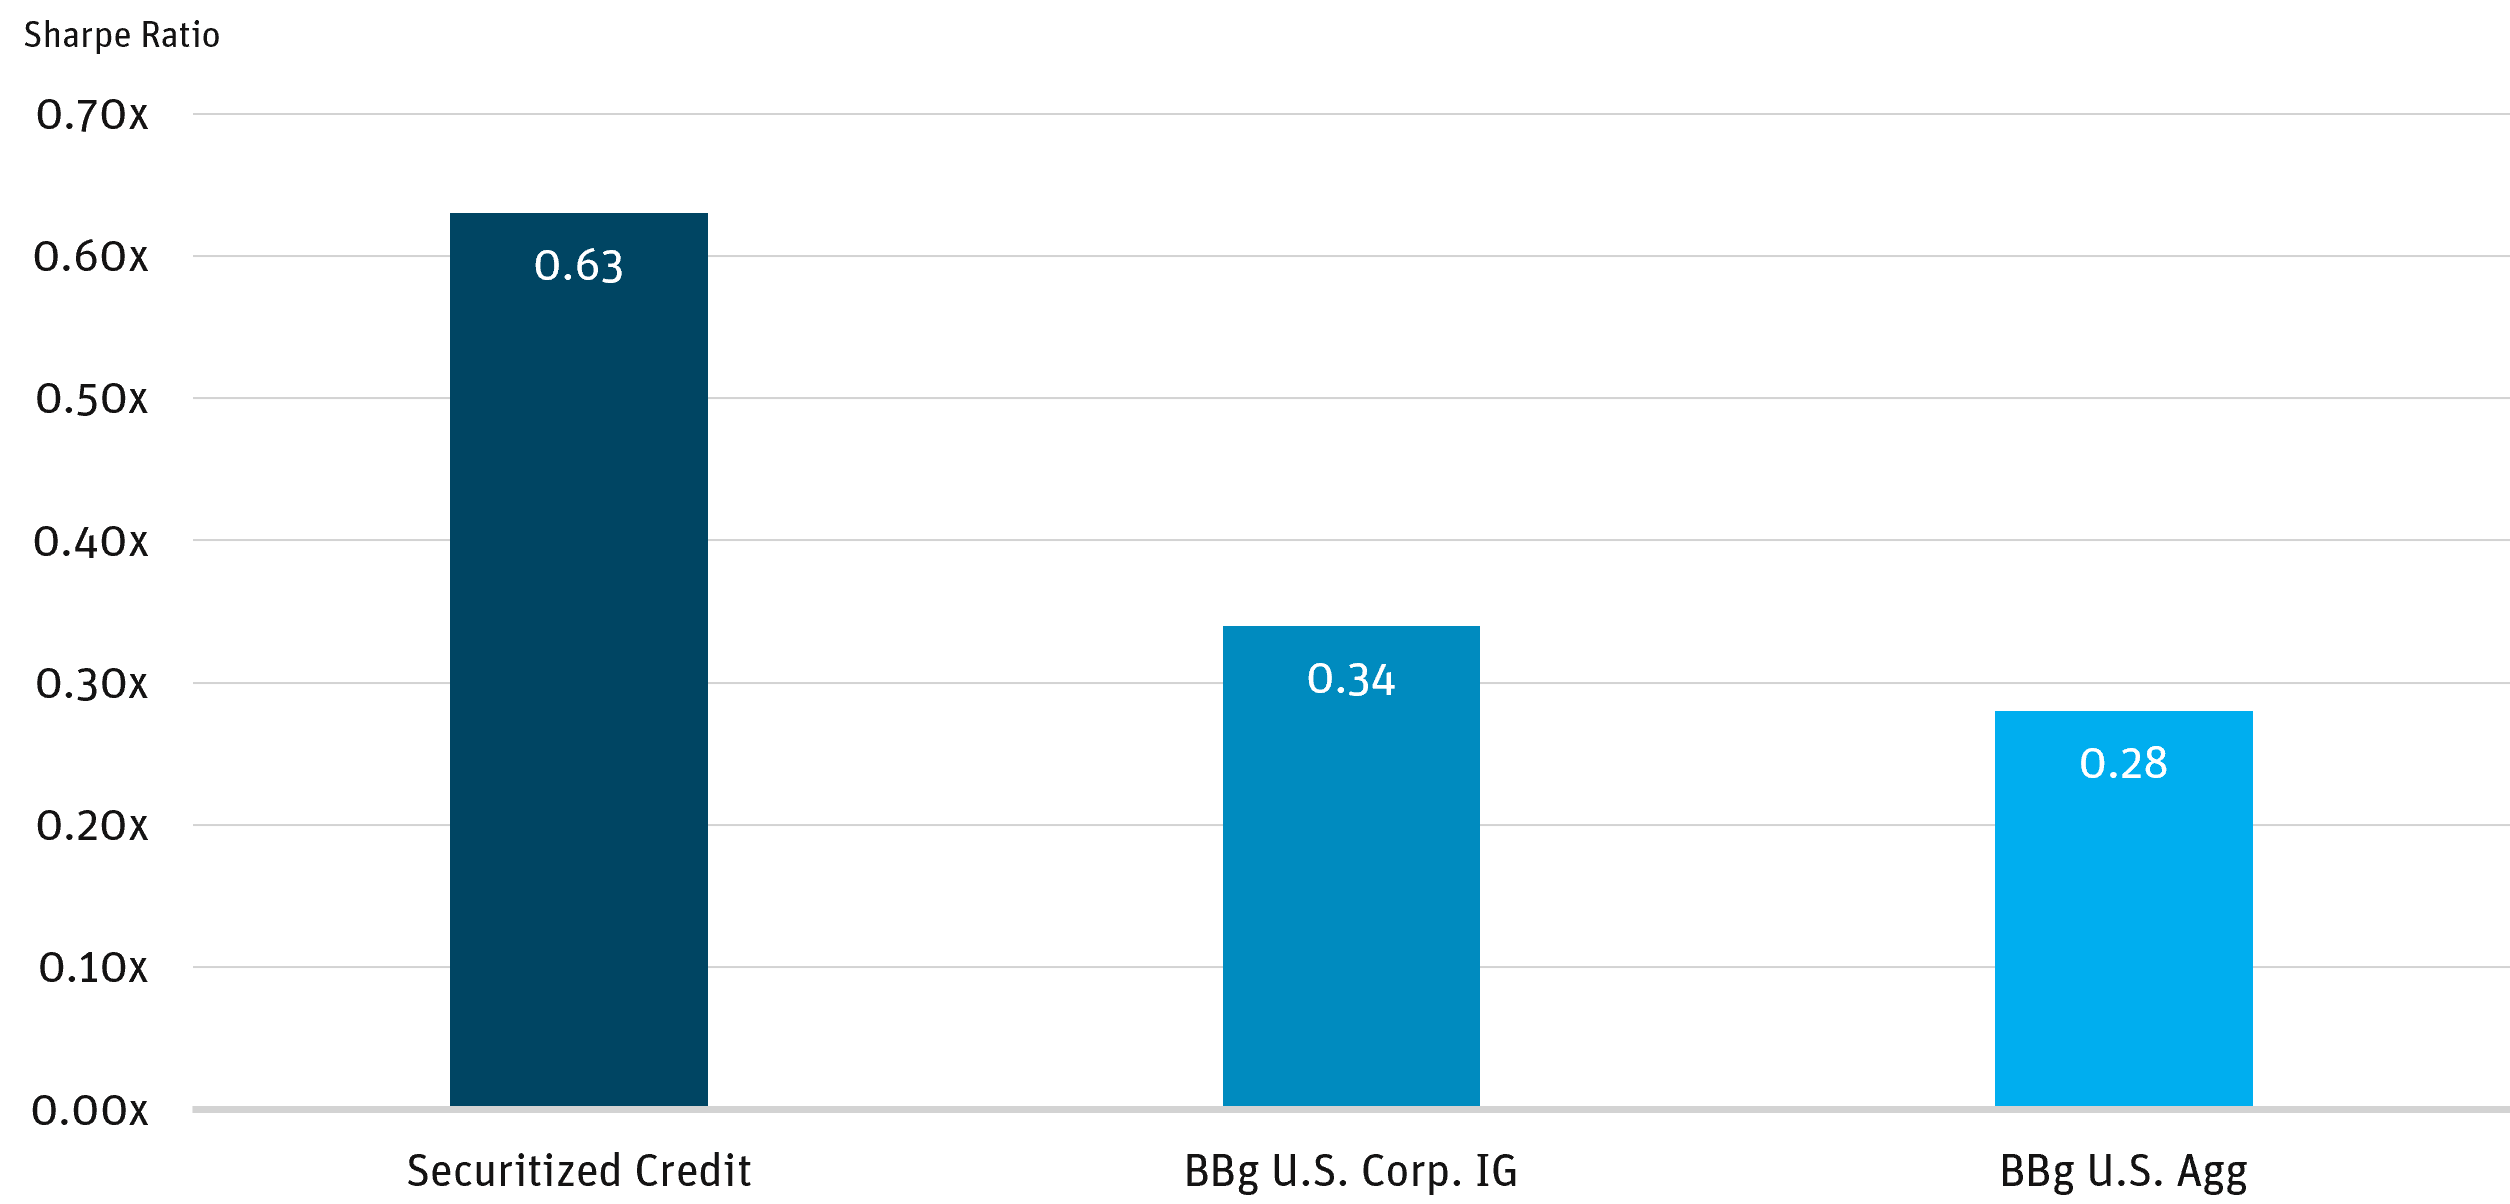
Source:BofA Global Research as of 9/30/25.
4. Overweight Agency RMBS vs. Treasuries Within Government Allocation
The majority of the government bond allocation in the Agg comes from Treasuries. Agency RMBS bonds offer a spread premium relative to Treasuries due to the prepayment risk embedded in agency bonds
(Figure 9 depicts current 30-year agency RMBS over time).9 Currently, agency RMBS spreads are wide relative to Treasuries; these can potentially generate higher returns while offering an implicit or explicit government guarantee of principal and interest. When agency RMBS bonds offer a premium, strategies seeking outperformance should allocate more to agency RMBS than to Treasuries versus the index.
Figure 9: Morgan Stanley 30-Year Fixed-Rate Mortgage Index
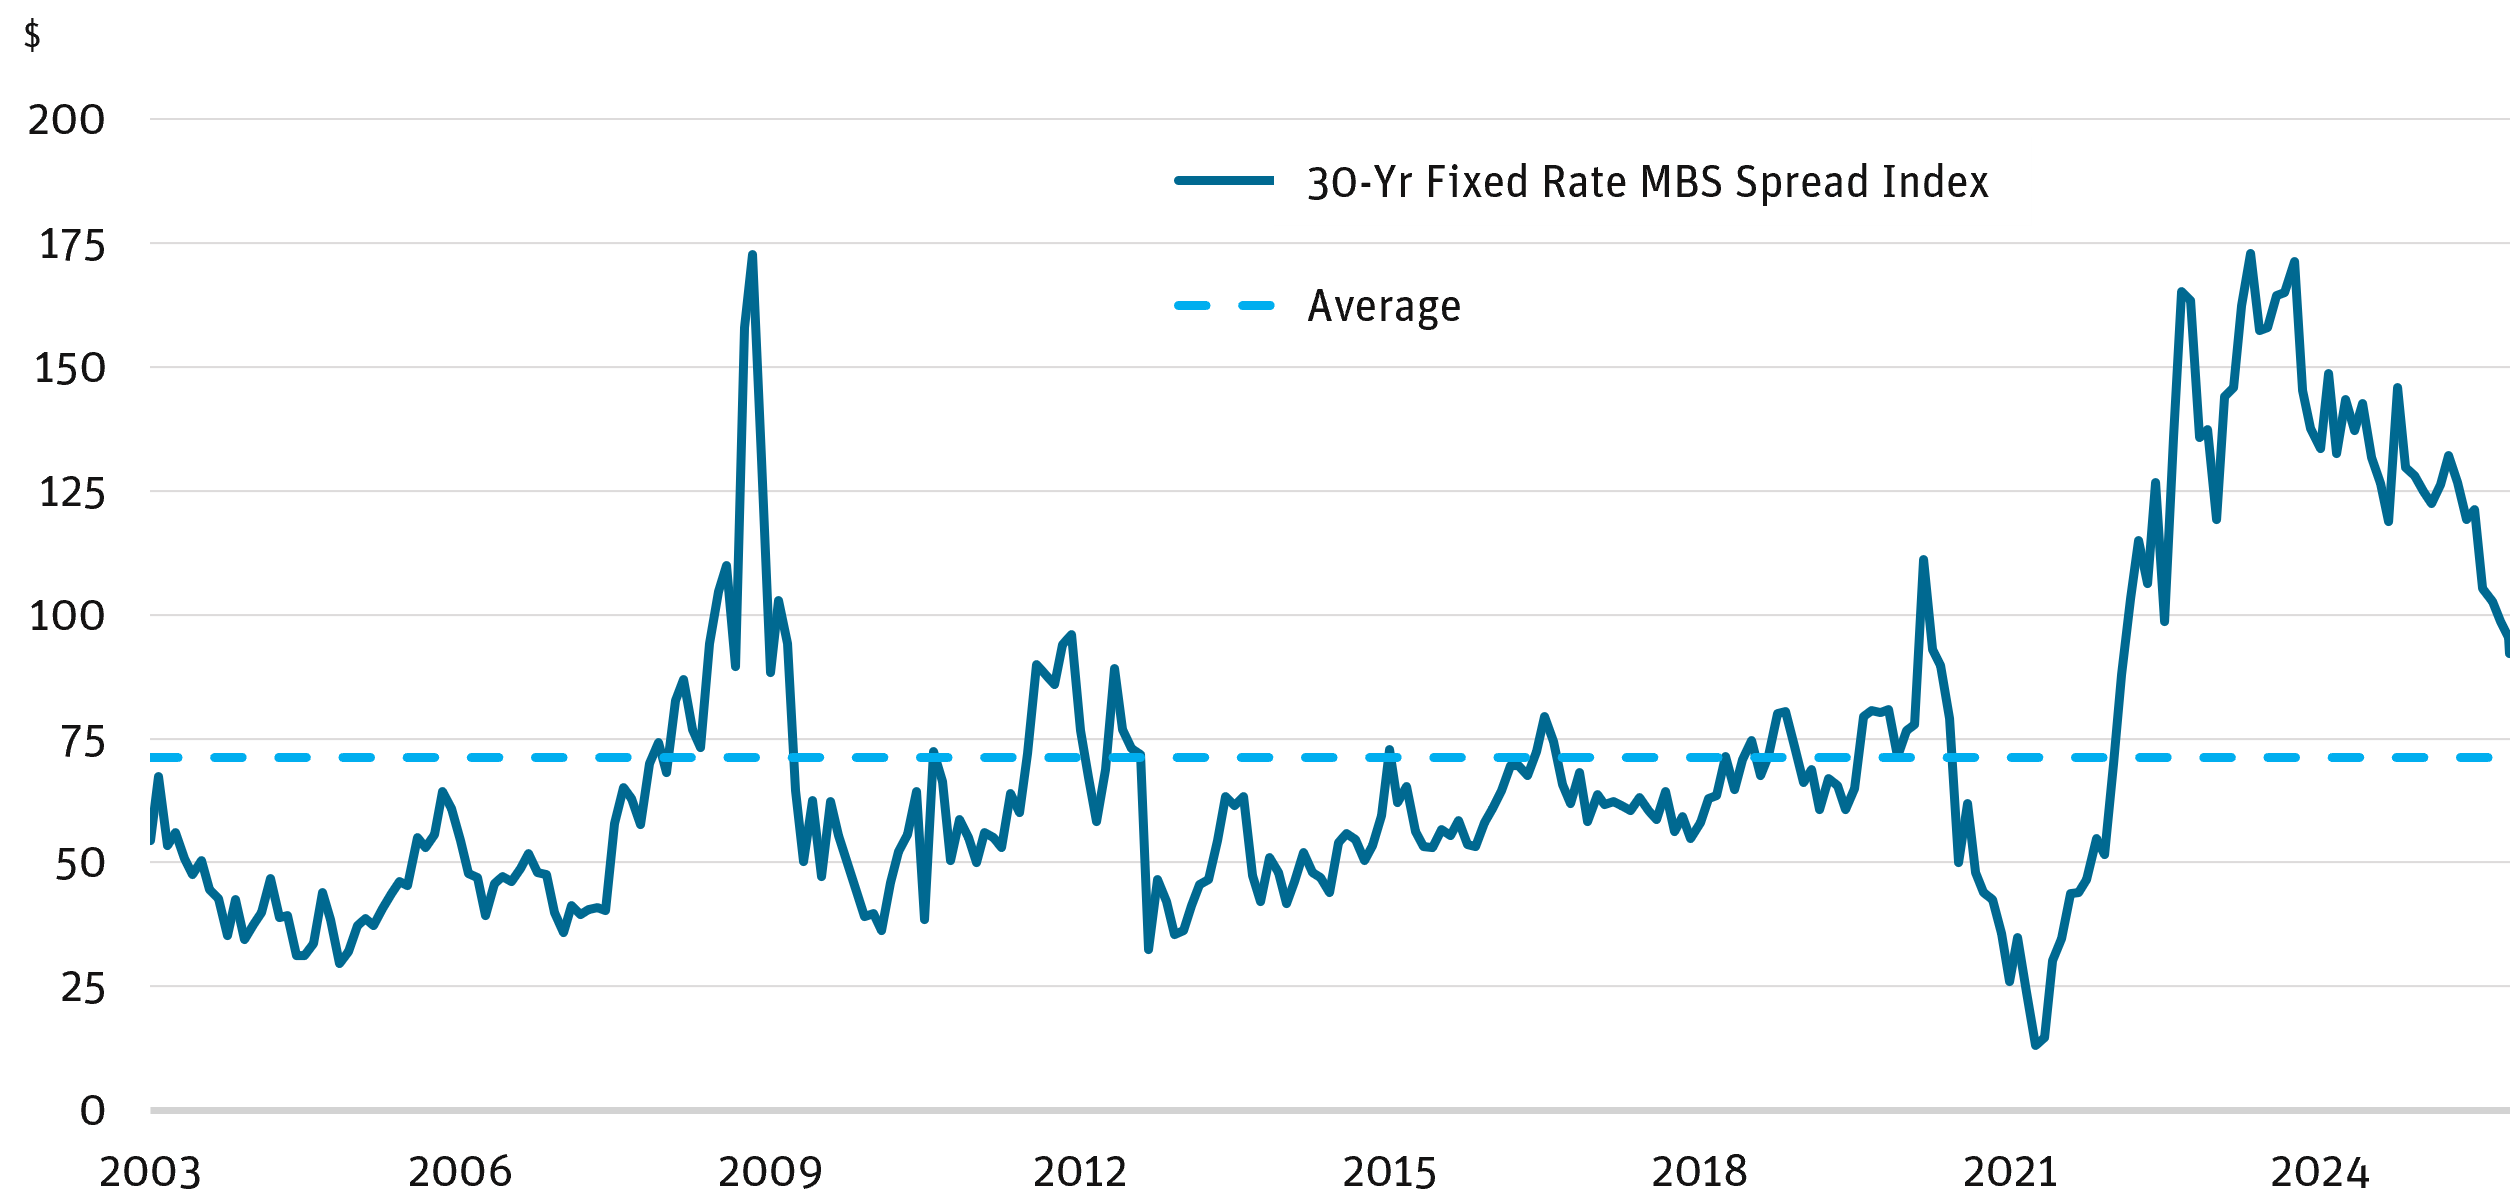
Source: Bloomberg as of 12/31/25.
5. Proven Security Selection Process
Market heterogeneity and complexity create opportunities for alpha in fixed-income security selection. Capitalization-weighted indices do not exploit this potential. A Core-Plus strategy must capitalize on this alpha to drive outperformance relative to the Agg. Achieving this requires a manager with a unique information edge, demonstrated experience, strong relationships with market participants, deep understanding of both traditional and esoteric asset classes, and a disciplined focus on risk management.
For both corporate and securitized credit, the process begins by identifying companies or collateral pools with strong cash flow potential to support debt service. For corporates, this includes companies with consistent cash flow growth, falling leverage ratios, and high profitability margins. For securitized bonds, we look for collateral assets that deliver strong cash flows driven by borrower performance—often greater in less-liquid, more esoteric collateral types.
After assessing cash flow characteristics, the process considers the bond’s position in the capital structure, including seniority and payment priority. We seek securities with attractive structural and collateral features.
Risk management is embedded in every step. Managers should review risks such as yield curve, interest rate, prepayment, duration, liquidity, and credit risk. This involves proprietary reporting, running thousands of bond- and portfolio-level scenarios daily, monitoring portfolio characteristics, and assessing attribution. These elements form the cadence that drives trading decisions aligned with strategy and fund objectives.
6. Limit Active Interest Rate Speculation
Successful Core-Plus strategies typically maintain interest rate sensitivity in line with the Agg for two key reasons. First, forecasting interest rates is inherently difficult. Even seasoned portfolio managers struggle to consistently predict the direction and magnitude of rate movements. Investment decisions based on rate speculation can overshadow the positive contributions from successful sector allocation and individual bond selection. Strategies are more likely to deliver long-term alpha by maintaining a duration similar to the Agg and focusing on higher-conviction decisions around sector relative value and individual bond selection.
Second, investors allocating to Core-Plus bond strategies often prefer duration profiles similar to the Agg (~5.85 years as of November 2025), with only moderate flexibility in duration management. These strategies sit in portfolios of ETFs where investors expect a certain duration profile.
CURRENT MARKET OPPORTUNITY
Within the framework outlined above, the following table reflects Angel Oak’s outlook given current market conditions.
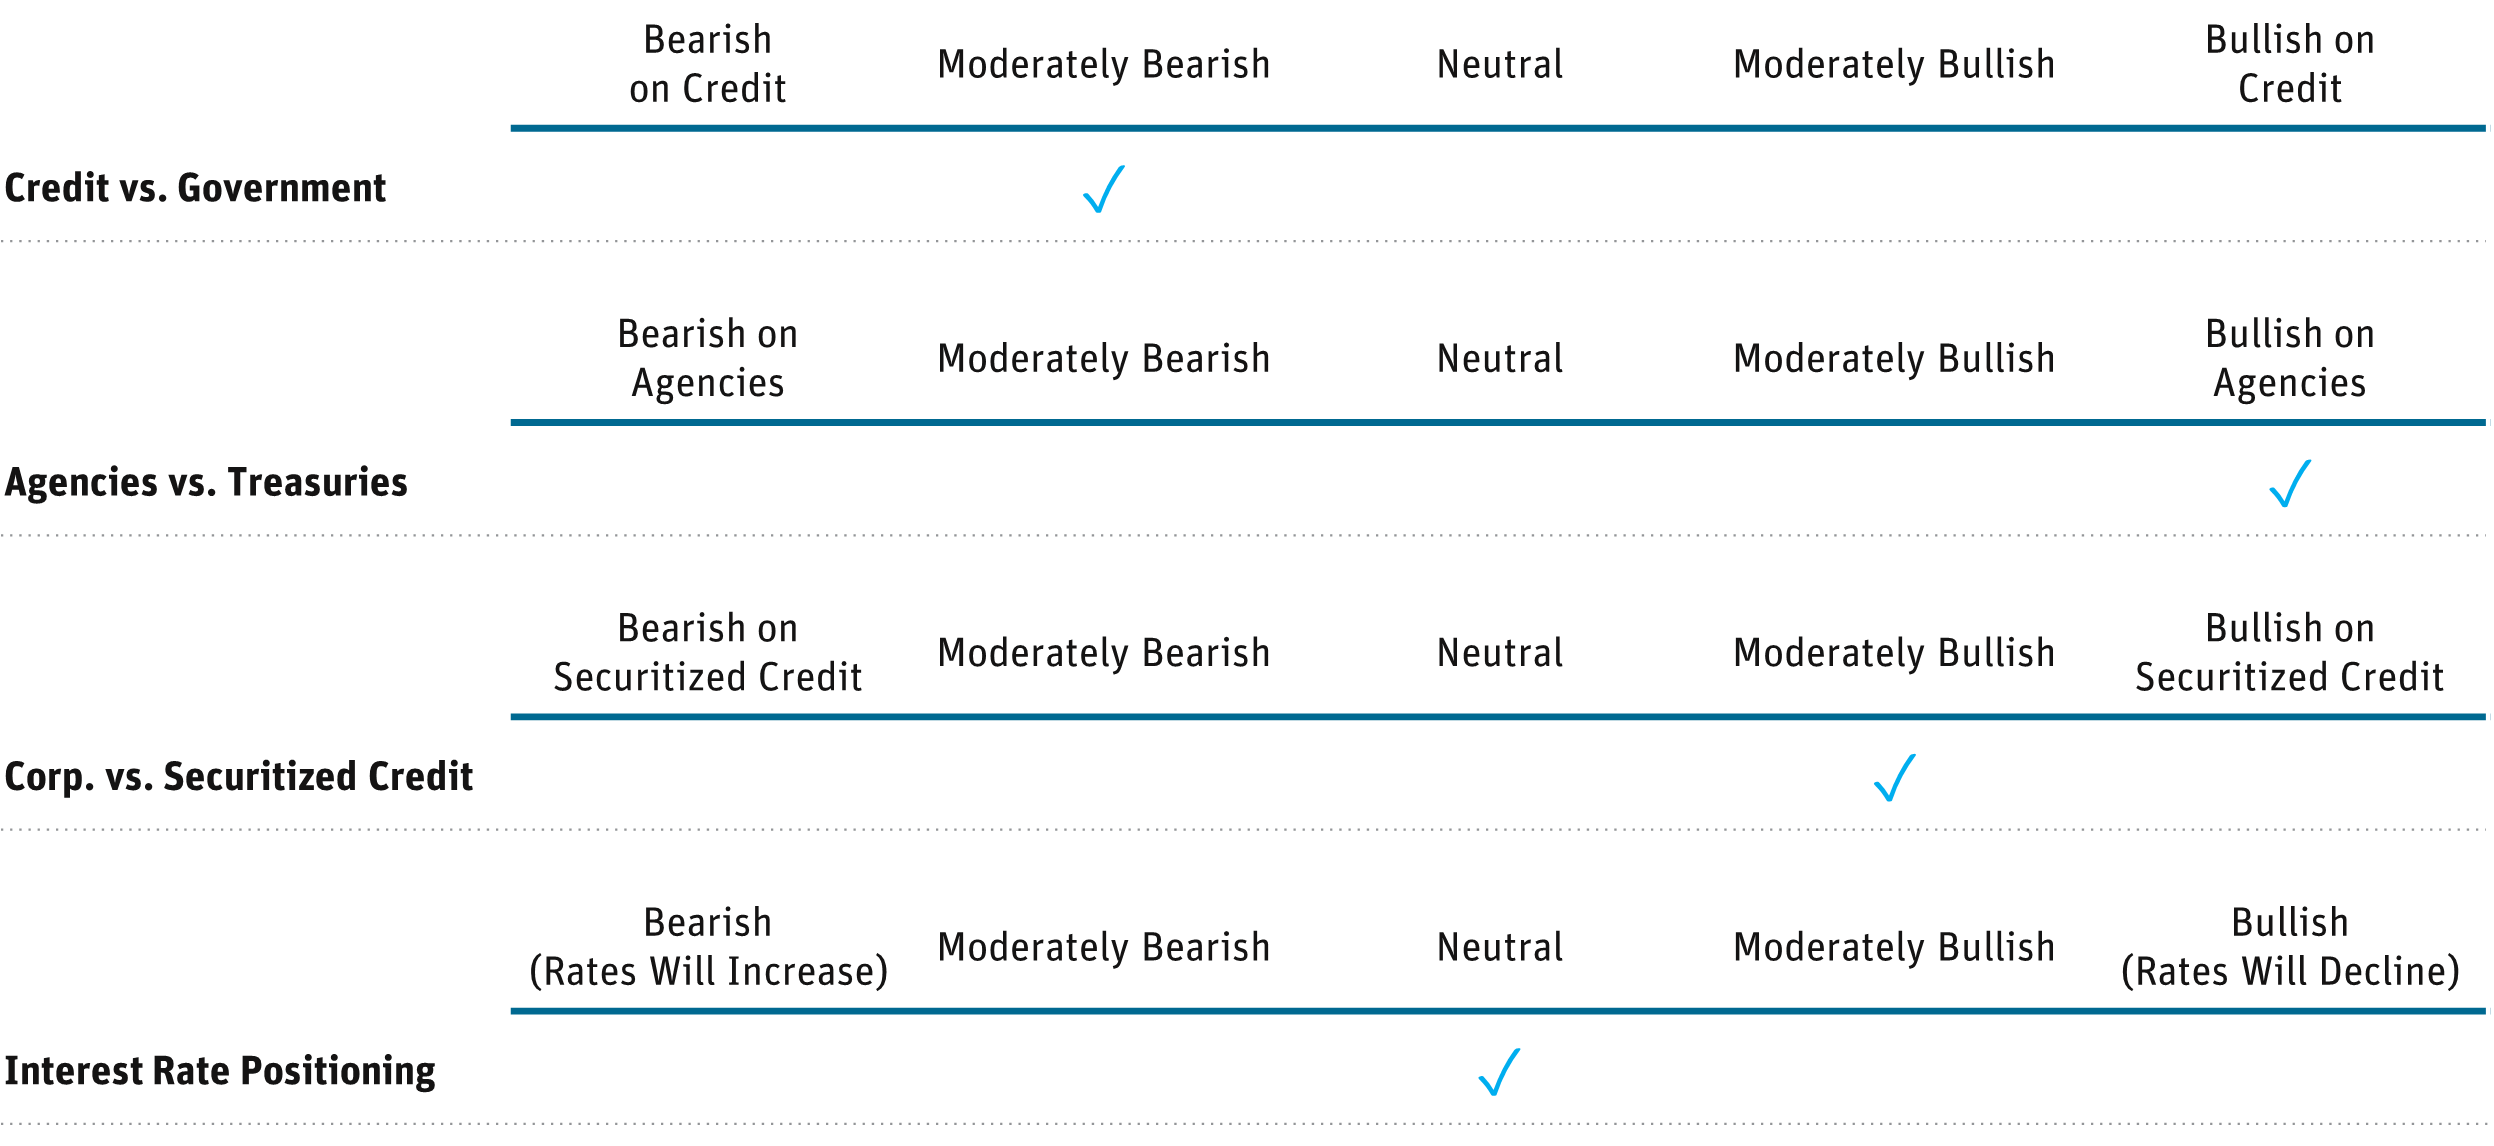
As Angel Oak thinks about building Core-Plus strategies, we are maintaining a neutral interest-rate stance relative to the Agg. We expect rates to remain range-bound, though we anticipate continued curve steepening.
Given historically low credit spreads, we are moderately bearish on credit. We plan to be less overweight credit relative to government than usual, as spreads remain tight—currently about 82 basis points (bps) versus a historical average of 133 bps since 1998.
Agency mortgages are trading wider than IG corporate credit for the first time in 20 years. Agency MBS present a relative-value opportunity driven by limited bank demand and elevated interest rate volatility. We are therefore bullish on agency MBS versus Treasuries.
Figure 10: Current Coupon Agency Nominal Spread Wider Than IG Corp. Index Spread
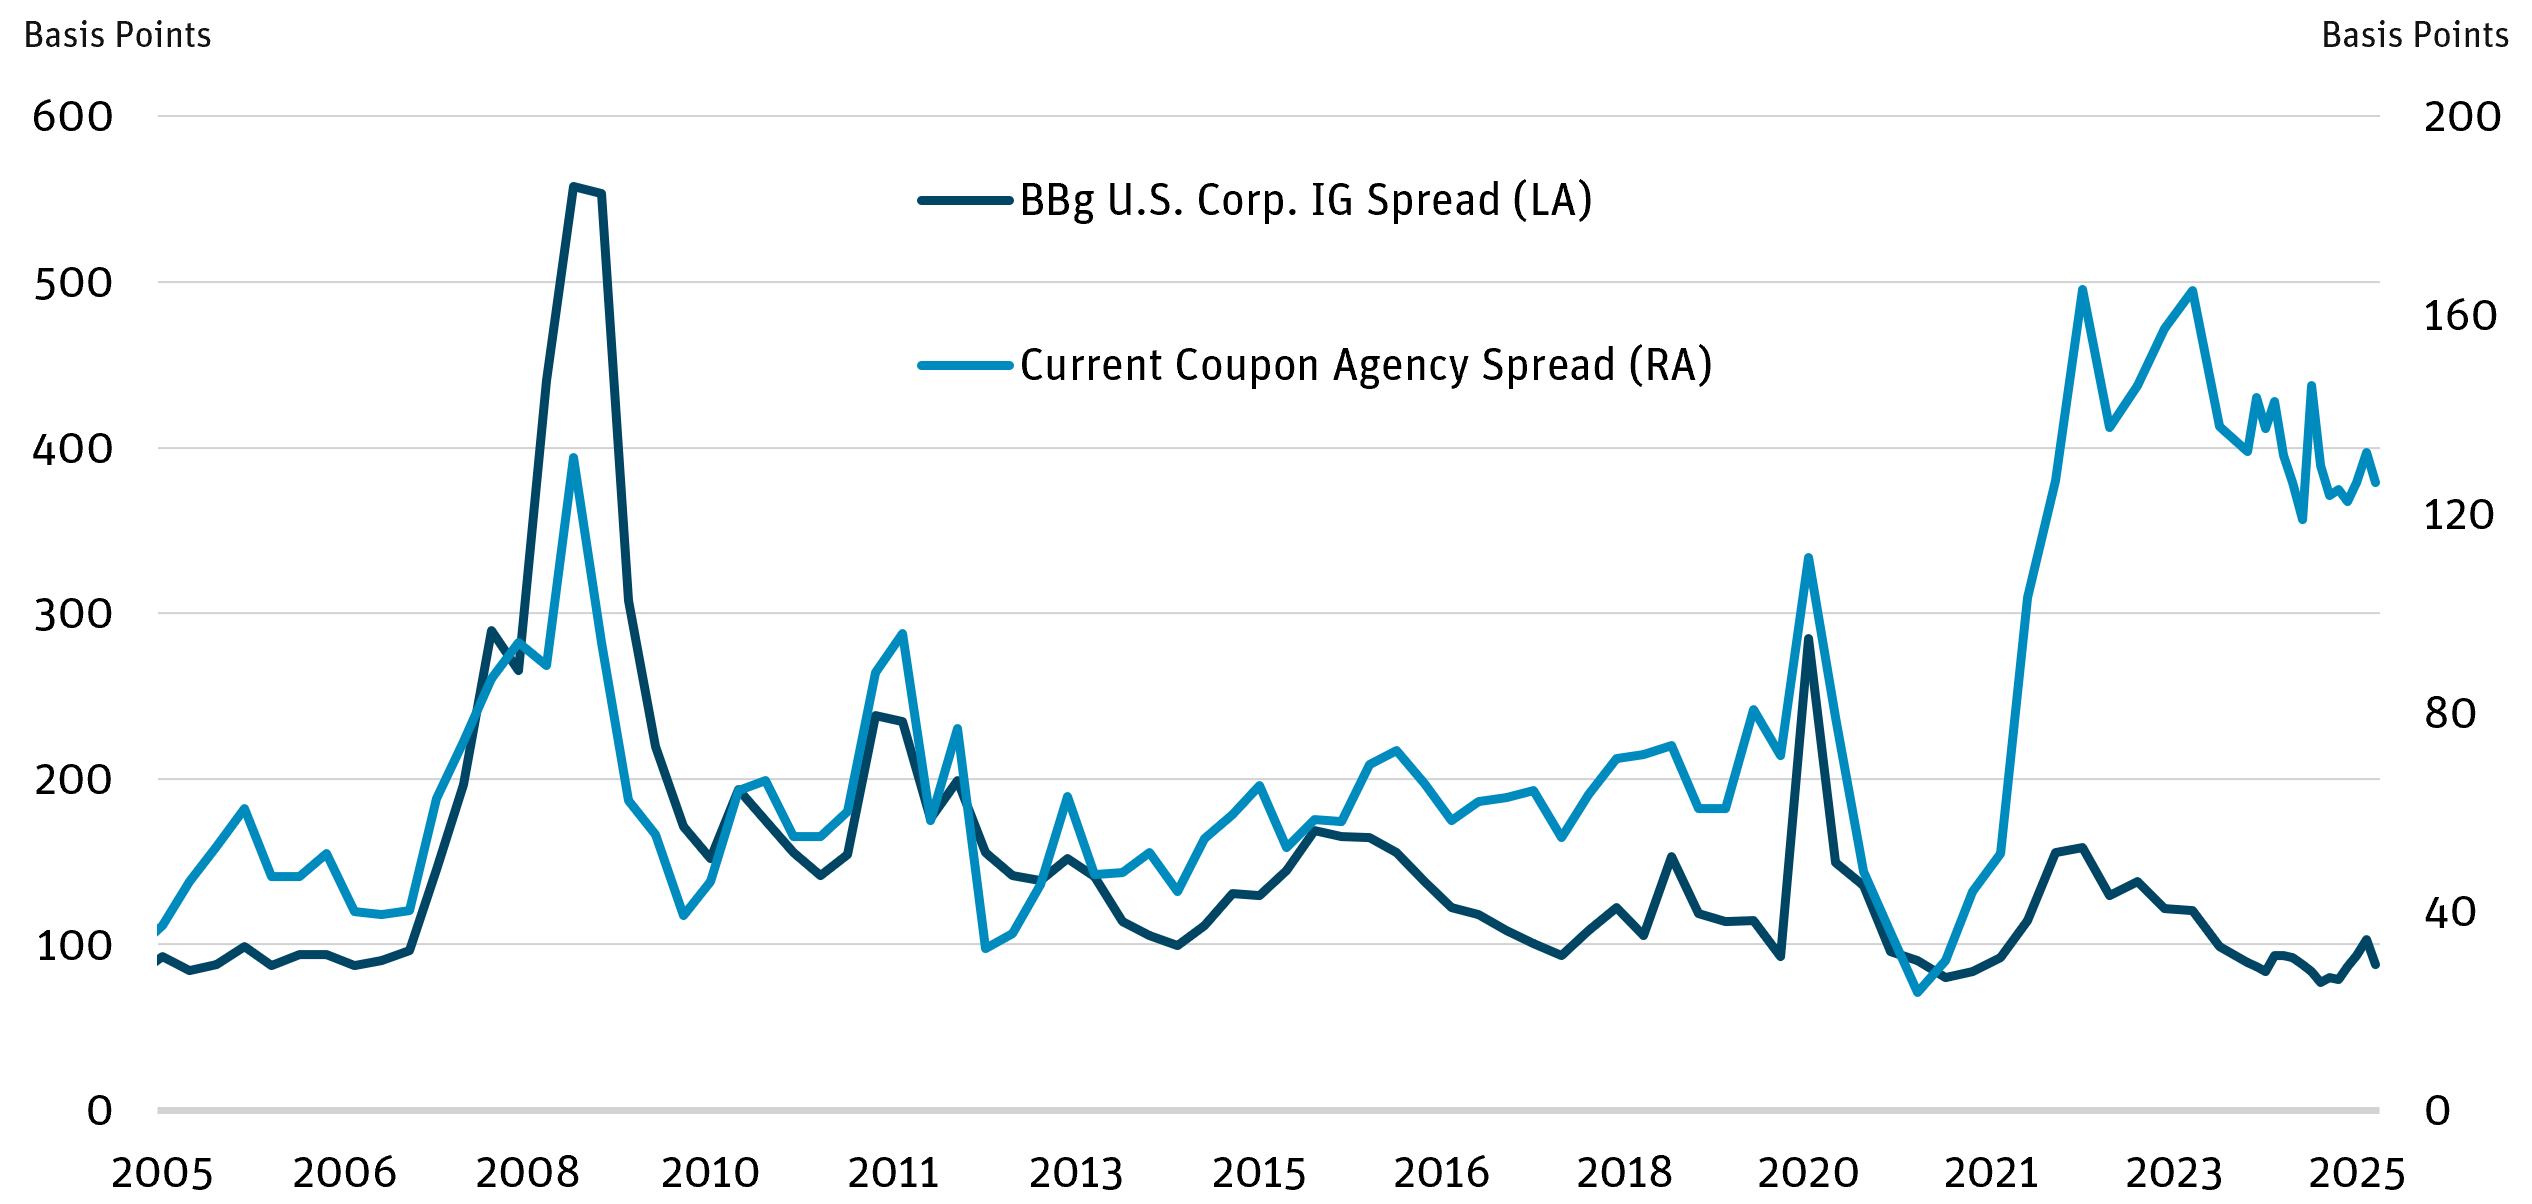
Source: Bloomberg as of 9/30/25.
We believe non-agency mortgages offer the most compelling relative value in the securitized space, supported by strong fundamentals, conservative underwriting, and a resilient housing market. Other securitized sectors—including auto ABS, credit card ABS, agency RMBS, and commercial mortgage-backed securities—also remain attractive. We have a strong preference for non-agency RMBS in prime jumbo and non-QM sectors, which provide significant yield pickup potential versus similarly rated corporates.
Figure 11: Non-Agency Mortgage vs. Corporate Spreads
Source: Bloomberg, Wells Fargo Non-Agency RMBS Spreads Report as of 9/26/25.
Footnotes
1 Morningstar, “Introducing Two New Bond Categories,” May 2, 2019
2 Morningstar, “4 Top-Performing Core-Plus Bond Funds,” May 13, 2025
3 Angel Oak Capital Advisors , “The Securitized Credit Premium,” October 15, 2025
4 Morningstar. Net of fees includes net of any appliable management and operational fees.
5 Morningstar Intermediate Core-Plus Bond Category.
6 Excess return is the total return of the index less its matched maturity Treasury.
7 Reflects the Bloomberg U.S. Corporate AAA, AA, A, BAA, and Bloomberg BB and B U.S. HY indices.
8 BofA Global Research Securitized Returns Report, Bloomberg as of 9/30/25. Securitized credit data calculated from excess spread over U.S. Treasury rates for actively traded securitized bond sectors.
9 Morgan Stanley 30-Year Conventional CC ZV Indicator. Represents the zero-volatility spread for a hypothetical $100-priced, 30-year conventional mortgage over time.
DEFINITIONS AND DISCLOSURES
Agency: Refers to securities, either direct debt obligations or pools of mortgage loans, that are issued or guaranteed by government-sponsored enterprises like Fannie Mae, Freddie Mac, or Ginnie Mae.
Alpha: Measures the difference between a fund’s actual returns and its expected performance, given its level of risk (as measured by beta). A positive alpha figure indicates the fund has performed better than its beta would predict. In contrast, a negative alpha indicates a fund has underperformed, given the expectations established by the fund’s beta.
Asset-Backed Securities (ABS): Securities created by buying and bundling loans—such as residential mortgage loans, commercial loans or student loans—and creating securities backed by those assets, which are then sold to investors.
Basis Points (bps): One hundredth of one percent and is used to denote the percentage change in a financial instrument.
Bloomberg U.S. Aggregate Bond Index: An unmanaged index that measures the performance of the investment-grade universe of bonds issued in the United States. The index includes institutionally traded U.S. Treasury, government sponsored, mortgage and corporate securities.
Bloomberg U.S.
Bloomberg U.S. Corporate Investment Grade Index: An index that measures the investment grade, fixed-rate, taxable corporate bond market. It includes USD-denominated securities publicly issued by U.S. and non-U.S. industrial, utility and financial issuers.
Bloomberg U.S. Credit Index: An index that measures the investment grade, U.S. dollar-denominated, fixed-rate, taxable corporate and government related bond markets.
Bloomberg U.S. Corporate High Yield Bond Index: An unmanaged market value-weighted index that covers the universe of fixed-rate, non-investment-grade debt.
Cash Flow: Periodic coupons received by the bondholder during their holding period.
Collateralized Loan Obligation (CLO): A single security backed by a pool of debt.
Commercial Mortgage-Backed Securities (CMBS): Fixed-income investments backed by mortgages on commercial properties rather than residential real estate.
Current Coupon: Refers to a security that is trading closest to its par value without going over par. In other words, the bond’s market price is at or near to its issued face value.
Duration: Measures a portfolio’s sensitivity to changes in interest rates. Generally, the longer the duration, the greater the price change relative to interest rate movements.
Mortgage-Backed Security (MBS): A type of asset-backed security which is secured by a mortgage or collection of mortgages.
Non-Agency: Mortgage-backed securities issued by private institutions that are not backed by government-sponsored enterprises or the U.S. Treasury.
Non-Qualified Mortgage (Non-QM): A loan that does not meet the standards of a qualified mortgage and uses non-traditional methods of income verification to help a borrower get approved for a home loan.
Prime Jumbo (PJ): Prime jumbo mortgages are non-agency loans typically because the lending amount exceeds the conforming loan limits. These tend to be high-quality mortgages with high credit scores that, for the most part, comply with agency mortgage underwriting guidelines.
Residential Mortgage-Backed Securities (RMBS): Fixed income securities with cash flows that are collateralized by residential mortgages.
Sharpe Ratio: A statistical measure that uses standard deviation and excess return to determine reward per unit of risk. A higher Sharpe ratio implies a better historical risk-adjusted performance. The Sharpe ratio has been calculated since inception using the 3-month Treasury bill for the risk-free rate of return.
Spread: The difference in yield between two bonds of similar maturity but different credit quality.
Yield Curve: The U.S. Treasury yield curve refers to a line chart that depicts the yields of short-term Treasury bills compared to the yields of long-term Treasury notes and bonds. The slope, shape, and level of yield curves may vary over time with changes in interest rates. Yield curve risk is the potential for losses in a fixed-income portfolio due to changes in the shape or slope of the yield curve, which affects the relative performance of bonds with different maturities.
Yield Pickup: The increase in return that an investor earns by switching from one investment to another with a higher yield, typically involving greater risk or longer maturity.
Opinions expressed are as of 12/31/25 and are subject to change at any time, are not guaranteed, and should not be considered investment advice.
Investing involves risk; principal loss is possible. The Fund is a recently organized investment company with no operating history. As a result, prospective investors have no track record or history on which to base their investment decisions. The Fund is non-diversified and, therefore, may be more susceptible than a diversified fund to being adversely affected by a single corporate, economic, political, or regulatory occurrence. The Fund may, at times, hold illiquid investments and could lose money if unable to dispose of an investment at a time or price that is most beneficial. Investments in fixed-income instruments generally fluctuate more than the prices of shorter-term fixed-income instruments as interest rates change. Investments in defaulted and distressed securities entail significant uncertainty regarding repayment. The Fund’s assets will be concentrated. The risks of concentrating in mortgage loans, RMBS (agency and non-agency) and CMBS include susceptibility to changes in lending standards, interest rates and lending rates; the risks associated with the market’s perception of issuers; the creditworthiness of the parties involved; and investing in real estate securities. For more information regarding these and other risks, please see the Prospectus.
ETFs may trade at a premium or discount to NAV. Shares of any ETF are bought and sold at market prices (not NAV) and are not individually redeemed from the Fund. Brokerage commissions will reduce returns. The Fund is an actively managed ETF, which is a fund that trades like other publicly-traded securities. The Fund is not an index fund and does not seek to replicate the performance of a specified index.
Investors should carefully consider the investment objectives, risks, charges and expenses of the Angel Oak Funds. This and other important information about each Fund is contained in the Prospectus or Summary Prospectus for each Fund, which can be obtained by calling 855-751-4324 or by visiting www.angeloakcapital.com. The Prospectus or Summary Prospectus should be read carefully before investing.
Ratings provided by S&P, Fitch, KBRA, DBRS Morningstar, Egan-Jones, and AM Best. Ratings are expressed as letters ranging from AAA, which is the highest grade, to D, which is the lowest grade. If the rating agencies rate a security differently, the adviser uses the highest rating. When a rating agency has not issued a formal rating, the adviser will classify the security as non-rated.
Index performance is not indicative of Fund performance. Past performance does not guarantee future results. Current performance can be obtained by calling 855-751-4324.
The Angel Oak Funds are distributed by Quasar Distributors, LLC.
© 2026 Angel Oak Capital Advisors, which is the adviser to the Angel Oak Funds.